System Behavior in a Company's Value
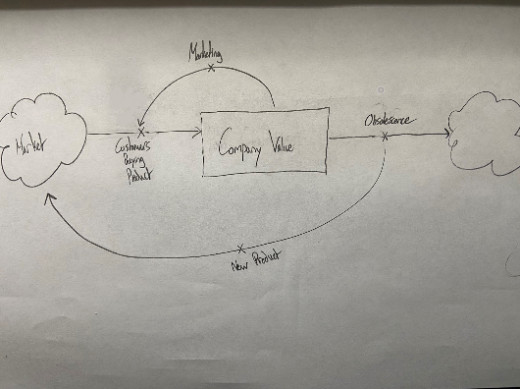
In a system representation of a company’s value in relation to their marketing, a single stock diagram can be drawn. The first cloud in the diagram is the market. If there is an available market that a company makes a product in, their value will increase as they receive more customers. If the company is starting out from the ground, there won’t be much feedback, as the company presumably does not have as much money to spend on marketing. I am not a business major, so I am by no means an expert on the subject, but I would assume the company would be relying largely on word of mouth from satisfied customers/consumers. However, when their value increases, they can dedicate more of their budget to marketing, increasing the amount of consumers who are aware of their product. Ideally, this leads to more buyers, and the start of a minor reputation, or at least a basic knowledge of the company. This is an example of reinforcing feedback, as the larger the company gets, the more money they can put to increasing their customer base. The ending cloud in the diagram is obsolescence. Without coming out with a new product, or at least an innovation upon one of their old products, the company’s value would probably decrease drastically, as it is no longer relevant with the times. Enter the second feedback loop. The company can save their value by coming out with a new product either in the same market or a different one, and repeating the process. However, their value would presumably be very high, and they should already have a value that supports their marketing budget right away.
Behavior Graph
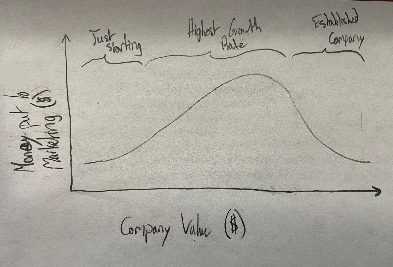
This graph represents the theoretical amount of money that a company could put into their marketing efforts, based off of their value at the time. At the start of the company, when it’s value is lowest, they will have to rely on word of mouth and their consumers spreading their product. As they increase in revenue and value, they can start producing ads and spreading their product rapidly. At their highest growth rate, they will be putting an increasing amount of money in. However, theoretically, the company will reach an esteemed status and require less energy to be spent in their advertisements, as their product will be well known enough. This is a common practice in companies that have massive followings, (Costco, KrispyKreme, Lululemon) or luxury vehicles (Rolls-Royce). A company such as Apple could easily slash their marketing budget if they weren't coming out with new products so frequently. In their case, it's the best way to keep their audience updated and eager.
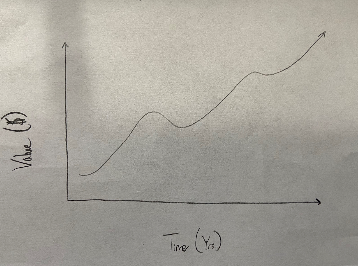
Value Over Time
This graph represents the value of the company as time goes by. Theoretically, the company will start with a low value, and go up as their product gains popularity. As they become more and more popular, their value increases, until the product starts to become irrelevant. This is represented where the graph starts to dip, and then goes back up assuming the company comes out with a new product. Ideally, the company would maintain this pattern forever, and keep increasing it’s value with new products so they never reach that point of obsolescence.
Discrepancies
As stated earlier in the article, I am not an expert on marketing strategies, or business. I am basing these massively simplified diagrams off of a systems thinking perspective. Factors not included in these diagrams but can certainly be looked at and analyzed includes investors, competition, and quality. For example, to highlight that last example, a company may spend much, much longer in the starting phases of the company and be unable to truly dedicate as much money to marketing if their product lacks the quality to warrant suggesting to others. If the founders of a company were to present on Shark Tank and win the favor of one of the Sharks, their value will skyrocket almost immediately and their business can focus more on the traditional marketing concept. Either way, the graphs I focused on in the article feature a look at a starting point for a Systems analysis, and can easily be modified to fit a specific standard. The point of modelling is, after all, to make adjustments.


