How to Buy Shares - Pyramiding Trades - Adding Stock Positions to Winning Trend
Pyramid Trading
Pyramiding trading in the stock market is adding more stock positions to a winning stock. A stock can only do three things in any defined time-frame, namely:
1. It can move in an upward trend
2. It can move in a downward trend
3. It can move in a sideways trend – a sideway trend is a period of consolidation
Exploiting the Trend to Our Advantage
Once a stock determines the trend to follow, it continues with that trend for a reasonably long period of time provided you have chosen your time-frame properly. This period can be as long as three months, six months or even a year. The trend is a ‘property’ of stocks and we want to exploit it to our advantage.
63 Days Time-Frame
A quarterly earning report is a report by a company that let shareholders knows how well the company has performed over the past three months. There are approximately 252 trading days in a year. A year has four quarters and therefore a quarter has 252/4 days equals 63 trading days. Our trading time-frame will be 63 days. You can choose 30 days, 40 days, 50 days, or whatever but one very important thing is to stick with the time-frame you have chosen. If you keep on changing your time-frame, then, you will soon find yourself in a lot of problems and without money to trade.
We now define the following:
- Up trend as that period when the closing price of the stock is above the 63 days moving average of its closing prices.
- Down trend as that period when the closing price of the stock is below the 63 days moving average of its closing prices.
- Whipsaw as shorter period of uptrend followed by shorter period of downtrend.
Adding Stock Positions to Winning Trend
A stock will always go in a sideways trend (a period of consolidation) after which it will breakout and follow a well defined trend either upward or downward for a considerable length of time. Once the stock has picked on the right trend, you just keep on adding your positions to this winning trend as the stock price moves on.
Exchange Traded Funds
Stocks to trade should be Blue chips that are unlikely to gap up or gap down abruptly. In fact I would recommend trading Exchange Traded Funds (ETFs). Exchange Traded Funds are good because they spread risks across other stocks, pay dividends, are less noisy, not very prone to rumors or manipulations, tight bid-ask slippage, and are unlikely to gap up or gap down abruptly.
Trading QQQQ Power Shares
We shall now look at an example in trading QQQQ power shares which is an exchange traded fund.
- First we get free daily prices from yahoo finance. You can read Basic Technical Analysis – Stocks Trading Basics- Get Free Stock Data from Yahoo Using Excel on how to go about it.
- Using excel worksheet, put the close of day prices in column A
- Get the 63 day moving average of closing prices by inserting the formula “average(A1:A63)”. Drag the formula down the column as you would want it to go, say, 300 trading days in to the past.
- Get the 32 day moving average of closing prices by inserting the formula “average(A1:A32)”. The number 32 is halfway between 1 and 63 and we need that moving average to isolate fake crossovers of the moving average of 63. Drag the formula down the column as you would want it to go, say, 300 trading days in to the past.
- Plot the two graphs using closing prices, moving averages of 32 trading days, and 63 trading days.
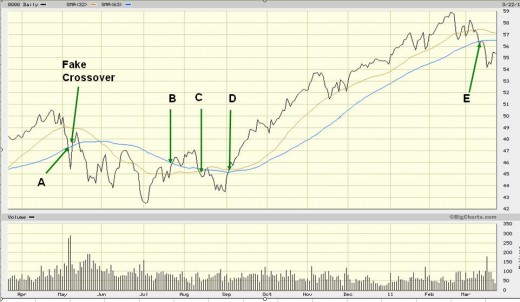
Now the graph is as shown below.

You Have to Get the Right Trend
From the graph above, there are the whipsaws for point A, B, and C during which we had to buy and sell positions at a small loss which is psychologically very disturbing. The biggest mistake you can do is to surrender when you are in whipsaws. Keep on taking those ‘little’ losses until when the stock will find the right trend which will compensate for the losses incurred in the whipsaws. You will sooner have to get the right trend because there is no other option.
Fake Crossover of Moving Average
Fake crossover is when the stock price crosses the moving average of 63 days without crossing the moving average of 32 days. In fact the entire band of moving average from 1 day to 63 days has to be crossed to valid that the moving average of 63 days has been crossed. Yes, you can not have ten without having 5!
How to Handle Whipsaws
If you might be interested in how to handle whipsaws without losing the trade, then, read the How to Buy Shares – Benefits of Whipsaws – Can’t Lose Trades. I must warn you here that those ‘can’t lose trades on trading whipsaws’ are not for amateur traders or inexperienced traders with small money.
Pyramiding Interval
In QQQQ, we shall add or short more shares every time the stock rises/falls by $2. The addition is only in favor of the trend as defined by our 63 days moving average line. The interval can be $1.5 or $2.5 – the choice is yours. But perhaps a simple way to go about it is to take annualized volatility of the stock, multiply it by the price of the stock and then divide by 4. For example if the stock is trading at $50 and the annualized volatility is 20%, then the pyramiding interval is (50 x 20/100)/4 equals $2.5. We now shall proceed, using an interval of $2, from point D in the chart shown above as follows:
Example on Adding Shares to Winning Trend
- At stock price 45.5, buy 100 shares at $45.5 total cost - $4550
- At stock price 47.5, add 100 shares at $47.5 total cost - $4750
- At stock price 49.5, add 100 shares at $49.5 total cost -$4950
- At stock price 51.5, add 100 shares at $51.5 total cost -$5150
- At stock price 53.5, add 100 shares at $53.5 total cost -$5350
- At stock price 55.5, add 100 shares at $55.5 total cost -$5550
- At stock price 57.5, add 100 shares at $57.5 total cost -$5750
- At point E, sell 700 shares at 56.5 total cost +$39550
Total net profit realized (39550 – 36050) equals +3500
You put $39,550 at risk to make $3,500. That’s 8.8% profit. Do you think this is worth a trader’s effort?
If you would have bought 100 shares at $45.5 and sold them at $56.5 without pyramiding, you’d have made 24.2% ($1,100) profit - this sounds better with only a few hurdles? Perhaps it’s worthy comparing pyramiding trading with How to Buy Shares – Benefits of Whipsaws – Can’t Lose Trades
Keeping a Hawk’s Eye on the Market
Pyramiding trading increases profits if the trend continues for a long period. The opposite is also true – pyramiding trading also increases losses when the trend reverses, and a trader needs to keep a hawk’s eye on the market.
Important: Pyramiding trading is a highly aggressive trading strategy suitable only for well disciplined traders who knows how to control risks by following a well defined trading plan.
The Author’s page is designed to help beginners and average
readers make some money as an extra income to supplement what they may be
earning elsewhere - details of which you can find in My Page, if you will.


