Risk Management: A Beginners Guide.
Risk Management - A Beginners Guide
Investment management rests upon some common beliefs about the nature of risk and return. Now let's look at the concept of risk management. In this article we are looking at investment risk in general and will not be discussing risk management software or any other technological tool. Other articles will explore the concepts of credit risk, business risk, corporate risk, banking risk, financial risk and market risk in greater detail.
Risk is measurable; meaning the distribution of an outcome in a group of instances is known. Risk is different from uncertainty, where the distribution of outcomes is unknown. This graph shows one way to measure the risk of stocks, which are the distributions of various stock returns.
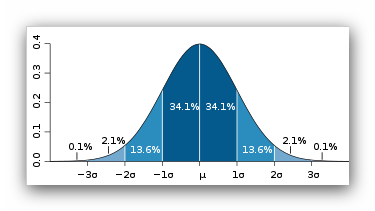
The Bell Curve
The bell curve is showing standard deviation of a stocks return. Say that the expected return of this stock is around 3%, then 68% of the time at a standard deviation of 1 the stock will roughly achieve the return of 3%. However, 14% of the time at a standard deviation of 2, its return will be between 1% and 3% and 14% of the time the stock will achieve a return between 3% and 5%.
We will return to this concept later.
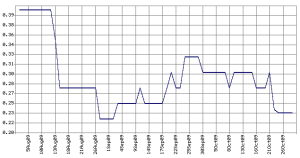
Let’s further define risk as a priori risk, that with fixed proportions such as the numbers on a die, and statistical, that for which records or statistics of past experience exist, like stock prices. You may recall from your statistics courses at school that the shape of the graph as in the example below indicates the amount of variance of the stock's returns. The buy points are at the bottom of the valleys and the sell points at the top of the peaks.
We may also divide risk into Systematic and Unsystematic risk. Systematic risk is the risk on any individual stock that is due to conditions affecting the market as a whole.
Unsystematic risk is risk unique to a specific company,such as management decisions, new government regulations or a strike etc.
Managing Risk (Avoidance)
How can we manage risk? Well risk can be managed in four distinct ways through avoidance, diversification, consolidation and/or specialization.
Let’s decide how to invest some money. We have many choices in front of us. For example, we can put our money in a regular bank account. This offers us virtually risk free investment because bank accounts are insured by the US Government and many other western governments up to a specified amount. Certain types of other investments, such as Treasury Bills offer the full backing of the US Federal Government. Because these investments are virtually risk free, the interest rates on these investments are called the Risk Free Premium. This represents the amount our money can earn while avoiding our taking any risks. Hence we have the term ‘risk management by avoidance’.
If the risk free return is, for example 8 percent, then it would be unwise of us to invest our money in a risky investment where the expected yield would be only 8 percent or even 10 or 12 percent when we can invest our money at 8 percent without assuming any risk at all. In fact, to make a risky investment attractive, it may have to offer us the possibility of 20 or even 30 percent return. The difference between a Risk Free Return and the return on a risky investment is called the Risk Premium. This is the amount of money an investor hopes to make from taking on a risk.
The risk-return trade off is one of the most important principles in finance. In simple terms, it states that an investor must be paid to take on risk.
When statistical measures are used to evaluate stocks, the Capital Market Line is used to measure the required return for a given amount of risk.
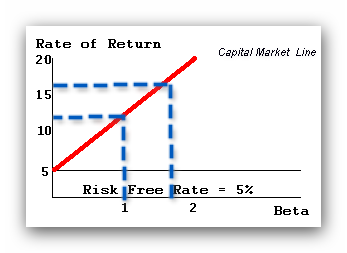
The line begins at zero risk and the amount of return on zero risk investments such as treasury bills or FDIC insured bank accounts. This statistical model assumes that the relationship between risk and return is a linear one. The higher the expected risk, the higher the required return, and conversely, the higher the expected return, the higher the likely risk for the investor.
The expected return for a risk factor of 1.0 would be 12 percent according to this graph and the expected return for a risk factor of 1.7 would be around 17%.
Diversification
Diversification relies upon the law of large numbers to reduce the average loss or gain. If investors have stock in one company, and the company runs into hard times, the investors may loose all their investment. So investors would diversify their investments across various industries such as food, transportation, manufacturing, and energy.
If an investor has several different types of investments, he or she can absorb the loss in one or more investments and still make profit over the long term. Loss from one investment is offset by gains from other investments. Investors may further manage risk by diversifying their investments in combinations of stocks which tend to go up and down in ways which offset the risks of each individual stock. For example, High oil prices may cause oil companies stocks to rise and a trucking company’s stocks to fall. Investors may choose to buy both stocks to offset the risk of any one investment.
Consolidation
Risk may also be managed through consolidation. Consolidation is the grouping of a large number of statistically similar cases together. This method is a commonly used by insurance companies. For a company offering life insurance, the likelihood of a single individual living less than or more than the average life expectancy is not measurable, because the behavior of a single individual cannot be predicted from statistics. However the life expectancy of a large group of insurance holders will conform to statistical models. The insurance companies can manage their finances according to statistics which apply to the group of clients as a whole.
Specialisation
Another tool of risk management is specialization. For example, specialists, convert uncertainties to a measured risk by grouping on the basis of similarities. The specialist in a stock is, by definition, a risk-taker, that prices the unique risk of buyers and sellers by maintaining a market in the security.
The specialist’s risk is minimized by specialization, their understanding of the market, access to information regarding limit orders, trading volume, and their privileged position, and their market making monopoly in the security.
Quantative Theory
Using these basic ideas, we will now turn our attention to a quantitative theory used to construct investment portfolios. Modern Portfolio Theory is a fundamental theory about market behavior used by investment professionals around the world. In my next article we will take a detailed look at the Modern Portfolio Theory.


