How Do We Know That CO2 Is Warming The Planet?

Introduction
How do we know that we really need to act on climate change?
That’s the big question for human society today. For climate ‘alarmists’, if we fail to act, we will suffer serious and perhaps catastrophic losses in blood and treasure. For ‘denialists’, if we act, we will waste vast sums of money to solve a non-existent problem and that will cause significant losses in blood and treasure.
How can we know what to do?
I’d suggest that we can look at the sources of the knowledge that we do have. That will put us in a better position to know what information is, or is not, trustworthy.
The big question above breaks down into three large sub-questions:
1) How do we know that CO2 (and other greenhouse gases) cause planetary warming?
2) How do we know that we are responsible for the measured increase in greenhouse gas concentrations?
3) How do we know that warming will be a bad thing if it continues?
Let’s take them in turn, one or two Hubs per question. In this Hub we'll ask:
How do we know that CO2 (and other greenhouse gases) cause planetary warming?


So how *do* we know CO2 warms the planet?
Most people are surprised to learn that this part of the story goes back deep into the 19th century. Mathematician (and Napoleonic official) Joseph Fourier had developed mathematical tools enabling him to accurately model the conduction of heat, and decided to use this ability to study the Earth’s temperature. What factors determined that temperature?
Fourier considered all sources of heat to the surface: heat from the Earth’s interior, heat from solar radiation, heat from space itself, and did his best to calculate how these interacted. At the end of the process, he was left with a mystery: the planet should be considerably colder than it is. He realized that something about the atmosphere altered the planet’s heat budget as he was able to calculate it. That ‘x-factor’ would later be dubbed, somewhat misleadingly, the ‘greenhouse effect.’ As Fourier wrote in 1824:
The heat of the sun, coming in the form of light, possesses the property of penetrating transparent solids or liquids, and loses this property entirely, when by communication with terrestrial bodies, it is turned into heat radiating without light.
Much information about energy flows in the atmosphere was gained over subsequent decades. But the essential question—what exactly was physically responsible for this mysterious effect?—remained unanswered until 1859.

In that year, an Anglo-Irish physicist named John Tyndall constructed an ingenious apparatus for studying the transmission of heat through various gases. He found, much to his surprise, that a number of them had just the sort of property that Fourier had inferred: though transparent to light, they were in varying degrees opaque to radiant heat. Prominent among them were water vapor and carbon dioxide.
Tyndall grasped the significance of this at once. If sunlight reached the ground and heated it (as we all experience fairly directly), but the heat could not so directly escape again to space, then those gases would act much as a dam acts in a river:
As a dam built across a river causes a local deepening of the stream, so our atmosphere, thrown as a barrier across the terrestrial rays, produces a local heightening of the temperature at the Earth's surface.
The modern scientific basis developed from there. To mention just a couple of highlights, the first mathematical model of CO2-driven global warming was calculated—by hand!—in 1896 by Swedish Nobel Laureate Svante Arrhenius. The result caused considerable interest, but research subsided into confusion and uncertainty after a few years.
In 1938, Englishman Guy Callendar updated and extended Arrhenius’s work. Among other things, he:
- Developed time series of temperature readings to demonstrate that global temperature was indeed increasing;
- Demonstrated that both atmospheric CO2 concentrations and temperature had increased since the 19th century; and
- Updated the physical theory by incorporating the then-new measurements of so-called ‘back-radiation’ from the atmosphere to the ground.

Callendar did much to inspire and inform the next generation of researchers, such as the Canadian-born Gilbert Plass, who developed computer software that enabled the detailed calculation of radiative transfers in the atmosphere. His work would eventually inspire comprehensive models of the Earth’s climate systems—atmospheric composition and circulation, ocean temperatures and circulation, and carbon cycles among land, sea, and atmosphere, and more.
A seminal figure in this work was Syukuro Manabe, a Japanese researcher who has spent most of his career in working in the United States.

In 1967, he and Richard Wetherald had used a simple one-dimensional model to calculate that a doubling of CO2 concentrations would raise global temperatures by around 2 degrees Celsius. (Then, as now, that was projected to be likely by the end of the 21st century.)
By 1975, the two had worked up a much more realistic three-dimensional model. That one showed a rise of 3.5 degrees.
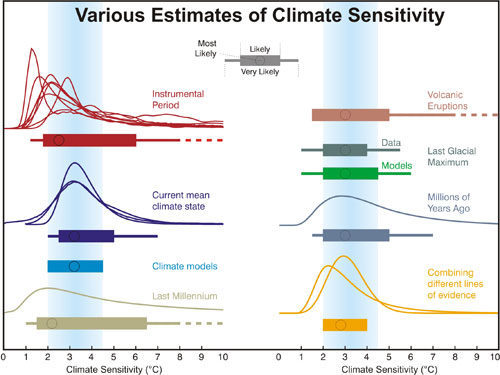
By 1979, the National Academy of Science “Charney panel”, tasked to examine what climate models had to say about the possibility of climate change driven by CO2, concluded that the panel was “unable to find any overlooked or underestimated physical effects” that could reduce expected warming below their range of 1.5 to 4.5 degrees C.
This estimate has held up very well; it currently represents the ‘likely’ range of sensitivity, according to the latest report of the International Panel on Climate Change. So we not only know that CO2 (and other greenhouse gases) cause warming, we have decent estimates of just how much they cause.
But what about observations?
What do we see happening with global warming and carbon dioxide in the real world?
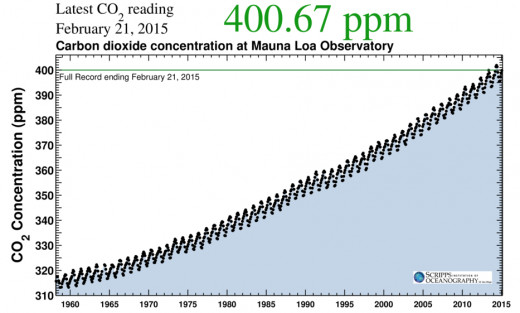
Taking the latter first, atmospheric carbon dioxide has increased roughly 40% since pre-Industrial times. Before humanity embarked upon its current fossil fuel binge, the atmosphere held about 280 parts per million. Now that figure stands at about 400 parts per million. (As of writing, the latest available monthly estimate is for January, 2015, and that figure stands at 399.85 ppm. The most recent daily value you can see below.)
The best record of this CO2 increase is the graph of the "Keeling curve." I'll explain that curve a bit more fully later in this series of Hubs, but here's what it looks like as of this writing:
Temperature Observations
But what about temperature? Some may ask, "Hasn't the Earth stopped warming?" After all, it's frequently asserted (particularly in online discussions) that there has been 'no warming since [year x].' This has even been dubbed the 'pause,' or 'hiatus.'
The short answer is "No, it hasn't stopped warming."
It is true that warming trends have been slower, if calculated over the past decade or so. But these changes in trend are not statistically significant. And that is shorthand for "There is no reason to think that these short-term trends are the result of anything except variations in things like the "ENSO" cycle of El Ninos and La Ninas." And these variations will average out over time, leaving the long term trend dominant.
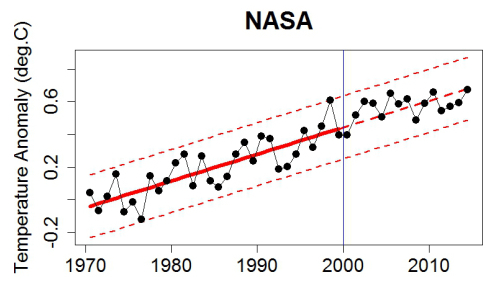
This is well-illustrated by an exercise performed by statistician 'Tamino.' Take the the surface temperature record from 1970 to the end of 1999. Extrapolate it forward to the end of 2014, and compare reality to the projection. What do you find?
Let 'Tamino' answer that question:
"Just what was expected, that’s what actually happened."
To be crystal clear, what Tamino means is that 2014 falls squarely on the projected trend line. (It's also the warmest year in the temperature record to date, beating the record set in 2010.)
Here's the graph illustrating the point, taken from Tamino's website:
The Wrap
So, to sum up, there is:
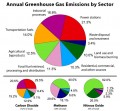
- A nearly two-hundred year record of scientific inquiry which has built a very strong understanding of how carbon dioxide and other greenhouse gases, including water vapor, warm the planet;
- A significant increase in greenhouse gases, and
- A strong observed warming trend.
(I consider the temperature observations a bit more in my Hub considering the climate 'impacts,' which is the jargon for 'effects of climate change'.)
So we know that it should be warming, according to physical theory, and that it is warming, according to observations.
What does the most authoritative assessment have to say about this?

Do you think CO2 warms the planet?
But are we responsible for this increase in CO2? That, of course, is the second question that we asked above. And that's considered in the next Hub in this series. It's just one click away; scroll down a bit, and just above the "Related Hubs", you'll find a button labeled "Next."
Check it out!
Relevant Hubs by Doc Snow
- Global Warming Science: A Thumbnail History
The science of climate change is much older than most people realize--some, like former astronaut Walter Cunningham, think that it was 'cooked up' by a few imaginative scientists early in the 1990s. The real story is much longer and richer. - Global Warming Science In The Age Of Napoleon: Jose...
Some think that the story of global warming science began in the 1990s. But the first paper on the topic was written by a scientist and mathematician who was also an administrator in the government of Napoleon Bonaparte! Read about his life and work. - Global Warming Science In The Age Of Queen Victoria:...
John Tyndall, a one-time railway surveyor, made himself one of the most prominent physicists of nineteenth-century Britain. But today he's remembered best for his discovery of the mechanism of the greenhouse effect. Read about his life and work. - Global Warming Science And The Wars: Guy Callendar
Guy Callendar lived through the tumults of early and mid-twentieth century England, doing technical and defense work. It's ironic that his innocent hobby led right back into the most polarizing political issue today. Read his story here. - When Did Global Warming Stop?
We often hear claims that global warming 'stopped.' Is there anything to this?