Gun Rights: Part 6: Conclusion: Will Reasonable Gun Control Save Lives?
BACK TO DEATH, GUN RIGHTS, AND GUN REGULATIONS
WE JUST DISCOVERED IN PART 5 that the lack or the presence of gun control has a significant influence on certain factors which make up the rate of Violent Crime. But, this fact is masked in the overall statistic because the rate of legal ownership acts in opposite directions on Murder and Robbery thereby canceling itself out. If this is the case, why is there such a frenzy of anxiety coming from both sides of the political aisle. What is a fact, however, is that current levels of gun ownership leads to 30,000 dead people a year from bullets entering their body after having been ejected from a gun of one sort or another ... 30,000, of which 3,000 were children.
So, what about Death by Gun? What have we learned since our initial attempt to provide empirical evidence and analysis of the relationship between gun ownership, gun regulation, and the number of people who die by gunshot? We found in Part 1 that a relation can be stated as an equation like the following:
LN(Rate of Death from all causes) =
.735 * LN(% of Ownership) +
.185 * LN(Population) +
.290 * e(1/Gun Density)
This says that:
- As the rate of gun ownership increases, so does the rate of death increase
- As the population increases, the rate of death increases also and,
- As the density of guns per square mile increases, the Rate of Death decreases; which to me is somewhat counter-intuitive but that is what the data shows.
Further, if we consider just the rate of total suicides, we get:
Rate of Total Suicides = .092 * % Gun Ownership + .008 * Median Age + .123 *Avg Annual Temp - 5.243 * Log(Gun Density)
Likewise, when considering the rate of Suicides by Gun, we have:
Rate of Suicides by Gun = .111 * % Gun Ownership + .4.553 * Log(Median Age) - 2.027 * Log(Pop Density)
We see from these two equations that:
- As the rate of gun ownership increases, so do both rates of suicides
- The same with increases in median age and mean annual temperature
- And finally if the higher the density of guns or population the lower the rate of both types of suicide.
So, what do these three initial relationships (plus the one regarding murder itself from Part 5) tell us? They tell us that in cases
- where guns are used to kill people,
- the higher the rate of legal gun ownership,
- the higher the rate at which people are going to die.
This makes intuitive sense to most of us and also is empirically substantiated by the data. The obvious, but impractical, solution to the 32,000 deaths by gun each year is to eliminate legal gun ownership in America. If that happened, then death by gun might drop to around 12,000 per year.
There are, however, very few people in America who think this is a good solution, or even a poor one; most think it is no solution at all and I am one of those. The real solution lies in appropriate regulation of legal gun ownership.
SYMBOL OF NON-VIOLENCE
DOES DIGGING DEEPER CHANGE ANYTHING?
WELL, LET'S SEE. IF I TAKE THE same independent predictor variables I considered in Part 5, what is the result? With a "Goodness of Fit" metric, R2, of 75%, this is a reasonably good model and it goes as follows (follow the bouncing symbols, sorry:
(Rate of Death by Gun)^.25 =
3.285636 +
1.843604*(Rate of Gun Ownership)^.25 -
.36155*(% of non-minorities)^2.4 -
.94246*(Rate of College Graduations)^.25 -
2.13014*1/(Rate of Post-Graduate degrees)^.5 +
.327361*(Ratio of Minority to non-Minority Income)^2.2)
R2 = .79
When I run the U.S. averages through this model, I get an answer of 10.67 deaths by gun/100,000 population; the actual rate is 10.21.. I am happy. So, what is going on with this model?
- If your goal is to decrease the overall death rate, you must decrease the rate of gun ownership
- To decrease the death rate, you can improve the economic and social conditions of minorities .
- To decrease the death rate, raising the education level, meaning more college graduates, would help
- To decrease the death rate, lowering the Post Graduate rate will help (I will explain that odd outcome in a minute
- And to decrease the death rate, increase the ratio of minority incomes to non-minority incomes.
Unlike almost every other model we have encountered, every predictor variable in this model can be influenced by public policy. In the other models, only one variable, if any of them, was subject to influence from public policy.
Now, to that oddity with Post Graduate levels. The reason it is working bassackward from common sense is that it is highly correlated with College Graduate levels; they move in concert with each other and are joined at the hip. Normally, this state of affairs would lead to discarding one of variable or the other. In this case, they help each other a bit in a balancing act between those two variables where the Post Graduate level moderates, or fine-tunes the impact of increasing College Graduation rates.
Again, including the ratio of minorities to non-minorities introduces the overarching negative effect of poorer economic and social conditions on the minority population. In this model, a new variable enhances this influence which is dividing average median income for minorities by that of non-minorities. This last variable has a positive sign which means the closer the median incomes of non-minorities to minorities, the lower the rate of deaths. In today's debate, this is an important aspect to remember.
THE FINAL STEP - REGULATING FIREARMS
WE HAVE COME TO THE POINT WHERE WE CAN PROPOSE a general public policy initiative that will reduce the 32,000 death by guns per year to some lower number. Based on the equation above, and one developed in Part >>>>, I will even take a stab at suggesting how many lives might be saved in different scenarios.
First, let me introduce you to a couple more charts, one is the short history of federal gun regulation and deregulation in America, and the other is a history of Death By Gun and the Rate of Death By Gun, just to keep things in perspective.
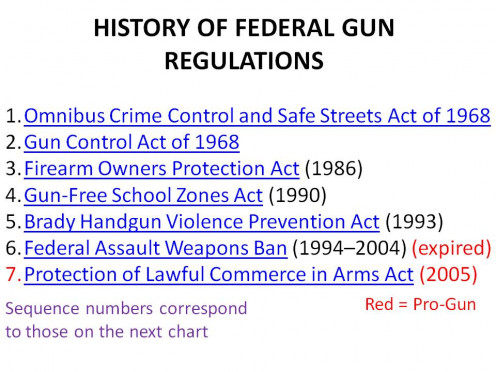
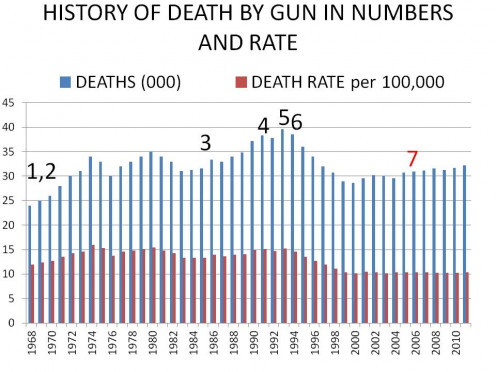
It should be easy to see that throughout the 1970s and 1980s, the trend in total deaths kept increasing, even with three different kinds of federal gun control measures passed by Congress. After 1974, however, after the first two gun control initiatives, the rate of deaths leveled out. The increasing trend in total deaths, in an increasing population, and the relatively level rate of death by gun lasted until 1993, when the Brady Gun Control Act was passed followed in 1994 by the Federal Assault Weapon Ban (which expired in 2004 and not renewed by the Conservative Congress). After those two Acts were past, and for the next six to eight years, America witnessed a historic drop in both the total number of deaths by gun, even though the population was still increasing, and a decreasing rate of death by gun, 25% and 33%, respectively! After that starting during the 2001 to 2003 time frame, both total deaths began to increase again and the rate of deaths leveled out.
Also, from the attempted assassination of President Reagan through the 1990s there was a major push in many states to implement more gun control. This was met with growing opposition by the NRA and the political Right. The tide seemed to turn toward the pro-gun lobby during the mid-1990s and coalesced with the 2001 Congress. It was only with the massacre at Sandy Hook elementary as a capstone to a series of highly publicized killings of children and political figures that America took interest again in trying to stop the bloodletting; and it can be curtailed to some extent. I hope I have proved to the open-minded over the last five Parts that the rate of legal gun ownership definitely plays a significant role in how many people are killed by guns each year.
I have also shown that sensible regulations reduce the rate of ownership while still protecting the 2nd Amendment rights of a States citizens. So, if one state can regulate guns within its borders with the positive result of reducing the rate of people dying from getting shot, why can't other states who hardly regulate their guns at all and have much higher rates of death by gun. In both cases the 2nd Amendment rights have not been abridged yet the citizens of one state are less likely to die from getting shot.than the other!
A BETTER RELATIONSHIP BETWEEN GUN OWNERSHIP AND GUN REGULATION
IF YOU RELOOK AT THE RELATION BETWEEN THE rate of ownership of guns in a given state and the strength of how that state regulates firearms, you find a highly correlated, inverse relationship. Normally, one looks for a "parsimonious" set of variables (few in number) to describe this relationship, but in this case, each time I added certain predictor variables, the amount of variation that was explained by that variable significantly increased, so I kept it. In the end, I finished with this rather large equation:
(% Gun Ownership)^.25 =
.814331 +
.103742 * 1/(Regulation Rank) ^.45 -
.06989 * 1/(Total Pop to Urban Pop Ratio) -
.08888 * (% Democrats in Legislatures )^.6 +
.32273 * 1/(Square Miles) ^.5 -
1.21869 * 1/(Post Graduate Rate) ^.35 -
.00011 * (Avg Urban Population) ^.5
R2 = 90%
In words, this says that if you want to live in a state where legal gun ownership is not as prevalent as another state, then find one who has 1) Stronger gun laws, 2) Where the Urban Population is a Larger Percentage of the Total Population, 3) Where the Percentage of Democrats in the State's Legislature is Higher, 4) a Larger State, 5) a State with a Higher Post-Graduate Rate, and 6) a State with a Lower Average Urban Population
SAVING LIVES !!!
THIS BRINGS US TO THE CONCLUSION OF THIS SERIES, well almost, there will be one more summary section after this one, then polls and links. All of this headache producing nonsense was to get to this point with, what I hope, is some understanding of the factors involved and some trust in the way that I have approached my analysis because if you do, then the conclusions I draw are pretty straight forward. The two equations offered in this Part are for estimating the Rate of Gun Ownership and estimating the Rate of Deaths from ALL Causes as a result of gunfire. I have presented in other sections that major cause of death by gun is suicide, then comes homicide. What I want to conclude with is presenting estimates of lives saved if states choose to improve their gun regulation laws to various degrees.
I shared in Part ??? a rating scheme of the Open Society Institute's A Comparative Survey of State Firearm Laws which determined the relative strength of firearm laws by state. When the rating was negative, it meant the states firearm laws were less than federal standards; if the rating was zero, they met federal standards, and if they exceeded federal standards. The magnitude of the rating gave you an idea of how much the state missed or exceed federal standards. Then I discussed how I transformed this data into a usable form for regression analysis so that the differences between rankings had an actual relative difference between them. That means if one number is a 2 and another number is a 4, that means the second number is twice as important as the first; it wouldn't necessarily mean that if it were just a simple ranking 1, 2, 3, 4, and so on.
Next, if you glance through the list of predictor variables in both equations, you will find that five of the variables can be changed by public policy, one can be changed by the People, and four are not controllable at all.
- The one that the People can change is the political make-up of their State Legislature
- The four variables that cannot be changed are:
- Racial demographics
- State size
- State urban population
- Total state population
- Finally, the five variables that can be changed by Public Policy are:
- Firearm regulation
- Other means to control rate of gun ownership
- College graduation rates
- Post-graduate rates
- The ratio of non-minority to minority incomes.
My focus throughout this series has been leading up to firearm regulations because that is the easiest and most effective way to save lives. So, how many lives will it save you may ask? Well, I will tell you.
BRINGING SUBSTANDARD STATES UP TO FEDERAL STANDARDS
That means changing enough laws in Alabama, Alaska, Arizona, Arkansas, Georgia, Kansas, Kentucky, Idaho, Indiana, Louisiana, Maine, Mississippi, Montana, North Dakota, Oklahoma, Texas, South Dakota, Vermont, West Virginia so that there study ratings would result in a "zero", or, in my scale, a 4.87 (negative numbers were 2.87).
So, the first thing I did was run my model to recalculate, state-by-state, an estimated Rate of Gun Ownership, based on the new Firearm Regulation rating. Then I used that result in the equation that estimates the number of deaths based upon, among other things, the Rate of Gun Ownership. Finally, I compare the this new result with a baseline result using the original data. Note, no other data changed save the ranking from the firearm regulations.
Here are the results.
The Baseline, based on my model, is 31,359 deaths (actual deaths, according to the CDC was 30,769, in 2007, 31,627 in 2010)
Changing the laws in the 18 states mentioned above just a little bit might lower the number of people killed by firearms by 508, or 1.6% to 30,852.
An almost 2% reduction just by coming up to federal standards.
BRINGING SUBSTANDARD STATES AND THOSE THAT MEET FEDERAL STANDARDS UP TO THE NEXT LEVEL.
This would be taking the states previously mentioned plus Colorado, Delaware, Florida, Nebraska, Nevada, New Hampshire, New Mexico, Oregon, Pennsylvania, Tennessee, Utah, Virginia, and Washington up to the level of firearm regulation possessed by such states as Iowa, North Carolina, and South Carolina.
In this case, the result is 1,508 lives saved and Firearm Deaths from All Causes falls to 29,852 or a 4.8% reduction.
And this from simply coming bringing firearm regulations up to that of three rather conservative states.who take the 2nd Amendment very seriously. It seems to me this should be well within the realm of the possible if gun rights advocates simply get off their high-horses and compromise a bit.
GETTING INTO LIBERAL TERRITORY (YES, THE PREVIOUS RESULTS WERE FROM CONSERVATIVE REGULATIONS)
Now we get into a more difficult scenario, mimicking such liberal leaning states as California, Illinois, and Maryland. But if one did, you might see an 8.8% drop in deaths.
Here, potentially 2,783 lives can be saved by bring total deaths down to a still too high 28,576.
Finally, we get to the most restrictive of state Gun Regulation laws, Massachusetts and Hawaii; not likely to happen, in my opinion. But, if it did happen, you could possibly see this:
If this happy state of affairs ever came to pass, one could expect a 10.8% drop in fatalities from guns, down 3,389 to 27,971!
Fantasy, I know, but nice to think about. One thing to consider, by the way, is that even these restrictive regulations, an anathema to conservatives without a doubt, still meet the 2nd Amendment test and if most states actually did choose to adopt this kind of control on firearms, that would mean there would have been a fundamental shift in America's mindset about guns. One where Americans finally come to recognize how deadly guns are and want to do what they can to mitigate their effect without endangering our right to bear arms. I feel this would amplify the results from my equations and increase the actual reductions in death by gun.
A RECENT PUBLIC POLICY POLL REPORTED that Louisiana, a state with one of the worst death by gun records in America, voters were 75% in FAVOR of background checks on ALL firearm sales including Internet sales, while 9% where not sure; only 16% were opposed. If conservative Louisianians understand this, why didn't Congressional Republicans, when they voted against a much more modest version?? It doesn't make sense does it?
Up to this point, even though some commenters tried to focus the conversation only on violent crime, I have avoided discussing what might actually help reduce it. My aim was to reduce total deaths and the death rate by gun. But, here, I simply want to point out that IF, background checks were performed on all firearm sales, it is my opinion (since I haven't done the research on this and am relying on common sense and logic) that crime in general, crime using guns, and homicides by gun would decrease after and an initial increase once the law was passed.
My rational for what conservatives will certainly consider a ridiculous assertion is thus. As shown in a previous table, crime is a minor source of guns for criminals. According to surveys of the criminals themselves, the most common sources are all legal and free of background checks; checks which would make purchasing weapons hard to impossible. The argument will go, of course, that all this means is the criminals will turn to crime to acquire their weapons; and I agree. That is why I suggest crime will initially increase. However, crime is a risky business, and not all, in fact lots of would-be criminals don't have the guts to commit a crime without a gun, do they don't including committing one to acquire a weapon (although they may entice someone else to do it for them). But, as I said, crime is a risky business and many of these criminals now forced to commit crimes to acquire weapons will get caught and taken off the streets ... with their guns. This, in turn, tends to lower the crime rate, over time if enforced strongly enough.
The end result is that not one honest citizen is denied a gun as guaranteed by the 2nd Amendment, but many guns are taken out of the hands of criminals buy denying them the best source of their firearms ... legal purchases. At least that is my theory and I am sticking to it.
LET'S REHEARSE
IN THE FIRST FIVE PARTS OF THIS SIX PART SERIES, I wanted to present the background and the kind of research that is needed to make thoughtful, fact-based policy decisions that literally determines if someone is going to live or die. This is the work that should be done by those trained to do it before the headlines are written and I hope I gave you some insight into this world.
I hope you are also walking away with an appreciation that you can't just read the headline "Majority of Americans Don't Approve of Obamacare" and believe it when in fact, it isn't true. Headlines are written to sell things, so they are provocative and often loosely based on the truth. Only later do some of the more respected news outlets go on to tell you that
"Well, that's not quite true folks, in reality, only 39% of Americans REALLY don't like Obamacare and what it stands for, another 17% think Obamacare simply isn't good enough and therefore don't like it for that reason, but if they had to choose between Obamacare and nothing, they would choose Obamacare."
That has been the story behind the Obamacare headlines ever since the top line number told a lie to everybody but a statistician; the statistician knew to ask the next question "Why" didn't someone like Obamacare.
In Part 1, we began by considering how predictive equations can be produced such that, assuming a relationship exists to begin with, knowing one set of facts can be used to predict another fact. In this Part, I tried, successfully I hope, to show how the Rate of Total Deaths from ALL causes, homicides, suicides, accidental, etc, could be predicted by knowing several other things, one of which was the Rate of Gun Ownership. It was found that a relatively simple formula (if you forget all those powers and logarithms) could be produced from the data which explain a reasonable chunk (97%) of the variation from what the model predicted and the actual data. I also attempted to unravel the secret world of statistics a bit to try to give some insight as to how this all works and why we think a successful predictive relationship can obtained between sets of observations that common sense says should be related. The point of doing what many would say is TMI (too much information) is deflect the "why should I trust you" comments. With the data that will finally appear in table (it is not complete yet) in Part 1, a statistician should be able to approximate my results.
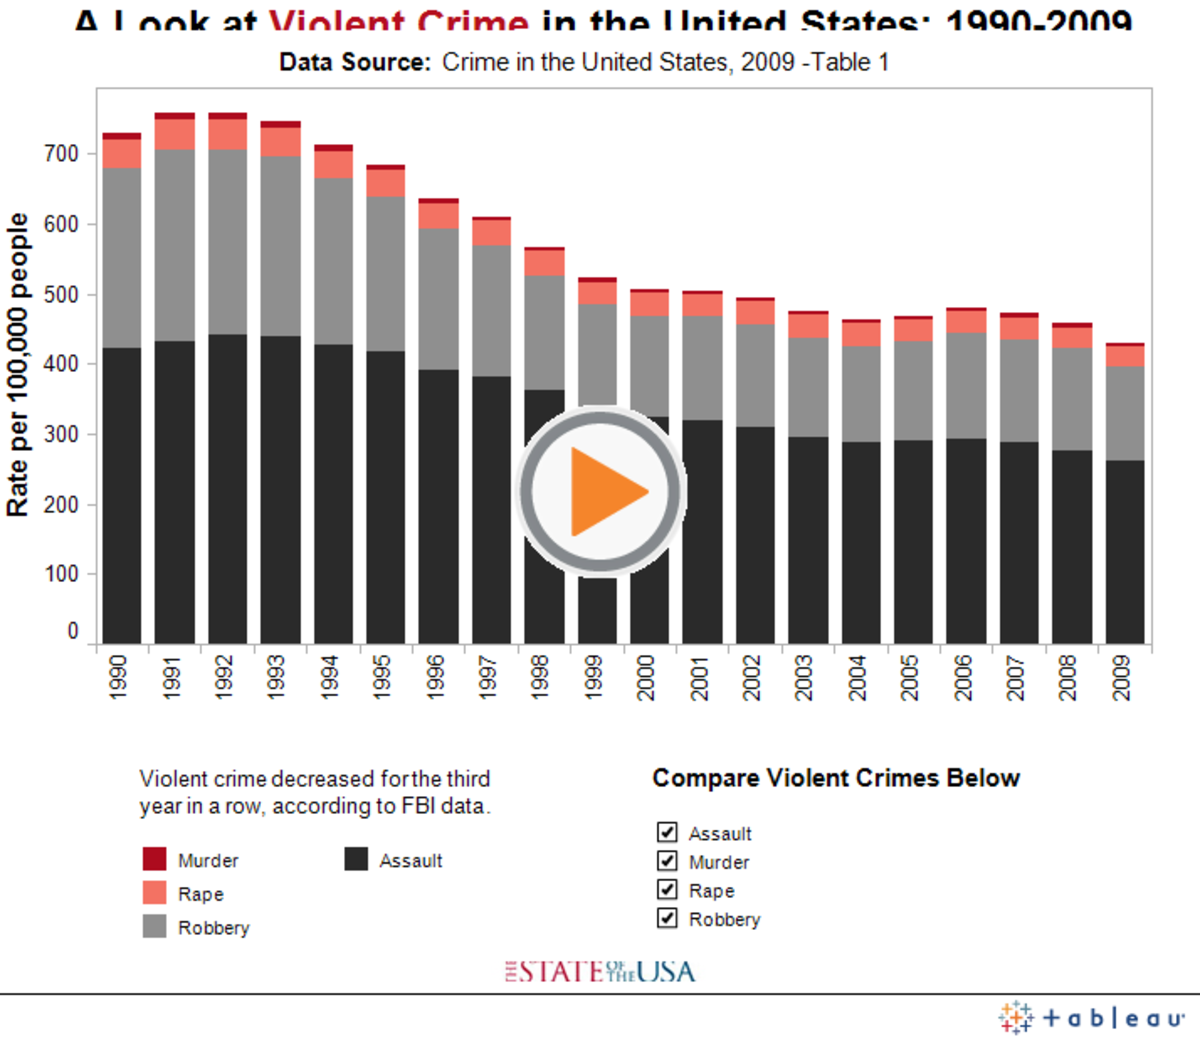
Part 2 began a consideration of violent crime as well continue the tutorial in statistics. The argument between the pro-gun and the pro-gun regulation lobbies is that the number of legal firearms on the streets has an impact on violent crime. One side says it makes it go up, the pro-gun regulation lobby, and the other side says it makes it go down, the pro-gun lobby. In fact, they are both right and they are both wrong, but you have to wait until Part 5, Digging Deeper, to find this out. At the end of Part 2, both are simply wrong. When you consider violent crime or any of its parts, Homicide, Aggravated Assault, Forcible Rape, and Robbery, a good model could not be made with the data at hand. This in-turn means the Rate of Legal Gun Ownership is not a factor in Violent Crime and should not be part of the conversation regarding regulating firearms.
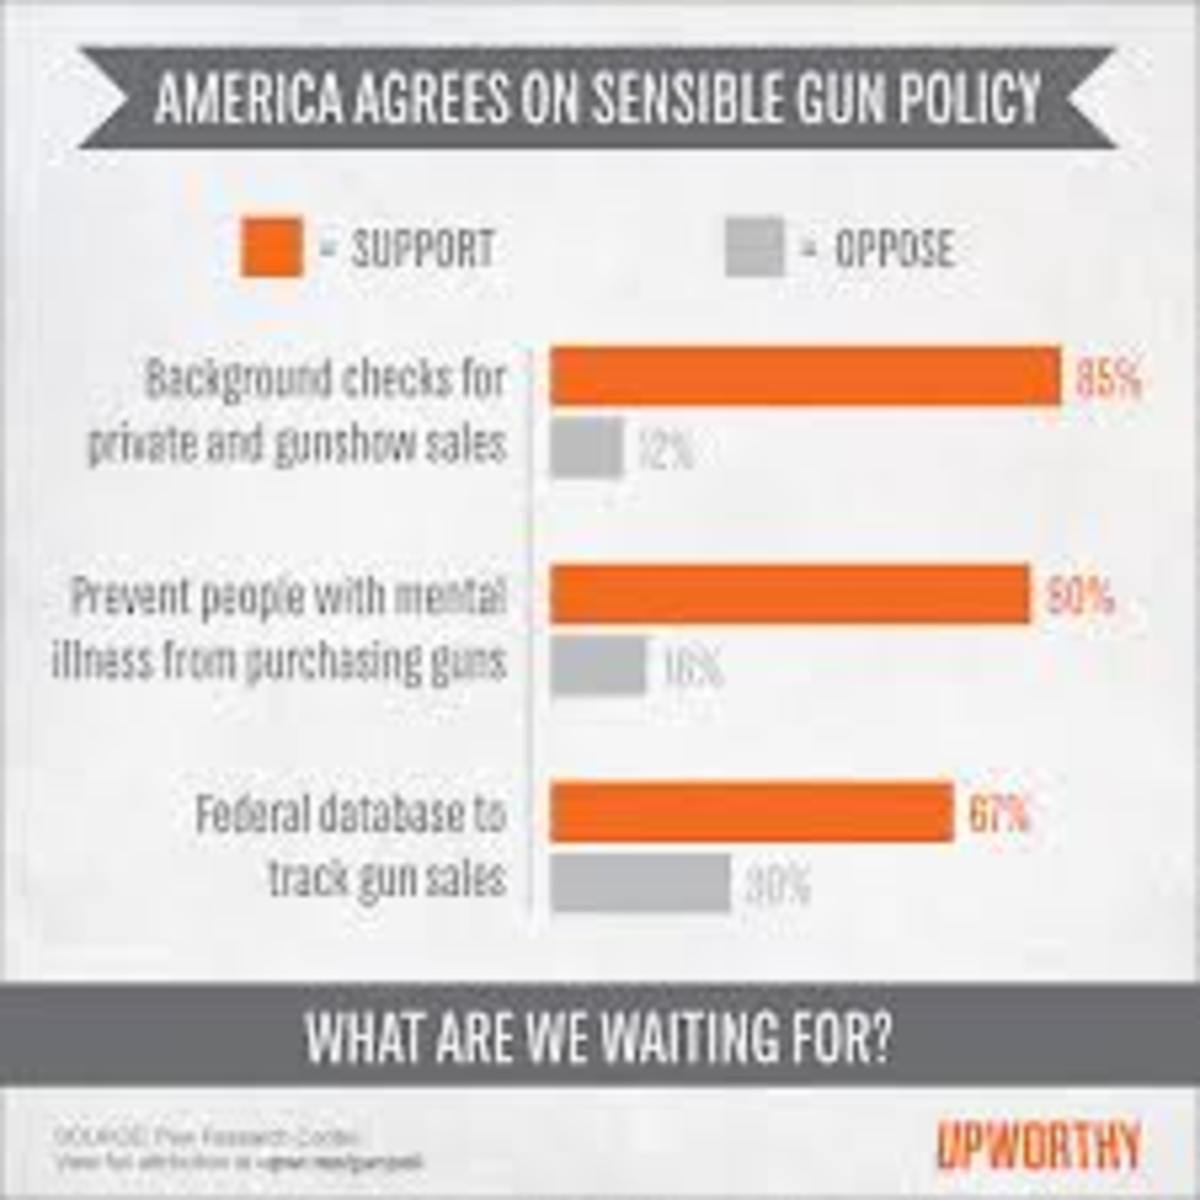
We turn to a different aspect of gun ownership in Part 3, the regulation of firearms. I start with presenting a table which depicts the five main reasons people are killed by guns; suicide (56%), homicide (39%), accident (2%), legal intervention (2%), and all other causes (1%). There is another chart that shows, if you can read it, that 85% of Americans favor background checks on ALL firearm sales, 80% of Americans think the mentally ill should not possess,and 67% believe there should be a federal database to track gun sales; that is an amazing result in a normally polarized society on most other social issues. From there, I move on to my main thesis of gun regulation and its relationship to gun ownership and show there is a good correlation, although I find a better one later in Part 5.
Part 4 reviews the terrible side of gun ownership, suicides. The fact that 56% of all gun deaths are suicides has to be disturbing. But, what is even more disturbing is that the current debate ABSOLUTELY ignores this sad fact. In fact, many ignorant advocates of gun rights say, astonishingly enough, that it is a smokescreen to the real problem, which we now know is a non-problem, violent crime! This attitude goes beyond the pale of understanding. In any case, a strong relationship was also found between the rate of gun ownership and total suicides as well as a very strong correlation between rate of gun ownership and the rate of suicides by gun.
In Part 5, I reconsidered all of the previous models regarding violent crime, in order to finally put the debate about that factor to rest in my mind, and looked for additional data as well as different ways to transform the information to make it more amenable to regression analysis. It worked. What I found validated the results from Part 2. Specifically,
- There is no particular relationship between the rate of gun ownership and with forcible rape or with aggravated assault.
- There is a negative relationship between the rate of gun ownership and the rate of robbery, meaning more legal guns on the streets, less robberies.
- There is a positive relationship with homicides, meaning more legal guns on the streets, more murders.
- The positive and negative relationships cancel each other out so in the aggregate, the rate of gun ownership is not a predictor of the rate of violent crime, only of the rate of death by guns, the rate of suicides, and the rate of suicides by gun.
Finally, in this Part, we reconsidered if there are better equations that can be developed to relate guns to death and regulations to guns; and we found out there were. Also, from the charts presented, it can be determined that federal regulation of firearms appear to have had a positive impact on the rate of deaths from firearms from roughly 1974 to 2000.
In the end, the who purpose of this series of hubs was to determine that if public policy were to change regarding stronger regulation of guns, without violating the 2nd Amendment rights of Americans to bear arms, would it have a significant role in reducing the number of people killed by firearms. Again, we found that it would, potentially from 1.6% to 10.8%, if my simple calculations are anywhere close to the truth!
Firearm Assault Cost You Money
11-1-2014: THIS IS AN ADDENDUM FROM AN ARTICLE I JUST READ at CNN.com based on an Urban Institute study using 2010 statistics titled State Variation in Hospital Use and Cost of Firearm Assault Injury, 2010, Embry Howell, Sam Bieler, and Nathaniel Anderson, August 2014. It reports on a study of six states; Arizona (-1, 14.6), California (53, 7.9), Maryland (43, 9.3), New Jersey (35, 5.2), North Carolina (18, 11.8), and Wisconsin (3, 8.8), as well as using National data, and determined the medical costs associated with firearm assault injuries (not just deaths and excluding self-inflicted wounds and unintentional); the numbers in parenthesis are 1) the raw regulation rankings, the higher the number, the better the regulations, and 2) the rate of gun deaths per 100,000 (keep in mind from the equations above, regulation is only one of the factors which determine the rate of deaths from firearms).
The conclusion from this study was that the cost to society as a whole is roughly $174 billion a year while the medical costs associated with injuries from firearm assaults run $669 million/yr. Of that latter amount, 73% or $489 million is picked up by you, the taxpayer through either Medicare, Medicaid, or because the victim was uninsured. As can be seen by Table 1, there is quite a variation between States as to how these costs are distributed.
Hospital Costs for Firearm Assault Injury
TOTAL COSTS ($M)
| PUBLIC/UNINSURED (%)
| |
|---|---|---|
ARIZONA
| $10.9
| 85.0%
|
CALIFORNIA
| $87.4
| 64.8%
|
MARYLAND
| $12.2
| 83.9%
|
NEW JERSEY
| $12.6
| 79.8%
|
NORTH CAROLINA
| $9.9
| 78.0%
|
WISCONSIN
| $3.8
| 78.7%
|
NATIONAL
| $669.2
| 72.9%
|
TABLE 1
HERE IS ANOTHER REASON TO BE INSURED
I KNOW THIS IS WAY OFF TOPIC, BUT IS NEED TO KNOW in today's argument over Obamacare. One of the tables in this study shows why it is important to have insurance rather than gripe about the mandate and being forced to buy insurance ... it may save your life. While these statistics apply only to deaths from gunshot wounds, I suspect they carry over to hospital care in general. Table 2 strongly suggests to me I would not want to go to a hospital without insurance.
FIREARM INJURIES LEADING TO DEATH
PRIVATE INSURANCE
| MEDICARE/MEDICAID
| UNINSURED
| TOTAL
| |
|---|---|---|---|---|
NATIONAL
| 5.0%
| 5.1%
| 8.4%
| 6.5%
|
ARIZONA
| 10.4%
| 4.6%
| 8.9%
| 6.8%
|
CALIFORNIA
| 5.9%
| 7.6%
| 11.9%
| 8.6%
|
MARYLAND
| 9.5%
| 12.2%
| 21.1%
| 15.6%
|
NEW JERSEY
| 3.9%
| 7.6%
| 10.1%
| 8.3%
|
NORTH CAROLINA
| 2.9%
| 3.5%
| 6.0%
| 4.8%
|
WISCONSIN
| 6.1%
| 6.8%
| 6.2%
| 6.5%
|
TABLE 2
A FINAL DISCLAIMER AND COMMENT
AS I TRIED TO MAKE CLEAR AT THE BEGINNING of this series, I am not an academic, nor am I a theoretical statistician. My background is applied statistics and cost/economic analysis for the Air Force and OSD; and that is dated now as I retired in 2008, and, I left active analysis work (until I started hub writing) about 8 years before that, although I helped out when needed. All total then, I had about 20 years of training and experience in this field.
As a consequence, this series of hubs is not a "rigorous" analysis, but nevertheless it is a practical and pragmatic one; the kind I would and did deliver (for a discrimination case) to my bosses. There are several things that could be done to improve upon what I have done, although I do think I have offered one unique approach; and that is a "holistic" look at this issue. What I mean is, in all of the research I did working on this series, I found research papers that would concentrate on this issue or that issue, but not one multiple issues at the same time such as I have done here. I would hope somebody much more qualified and who has access to much better data than I do has actually performed this kind of analysis, but I haven't found it yet.
My apologies for the intensity of the mathematics, but I felt it necessary to get above the "well, it is just your opinion" frey. It is not my opinion, it is the results of the information available from official sources used by all analytical organizations of any merit. I dare say I had a couple of my pet beliefs popped as I worked through the regressions and I still am curious as the the "why" of some results (not related to guns) as they don't make intuitive sense to me, but I nevertheless accept as correct for the moment because the results were stable. I really do hope my explanations made sense of things, and helped you get past the equations, and that the logic of it all worked for you. Finally, it is my fondest hope that I changed a couple of minds and put doubt in several others about the correctness of their stance vis-a-vis regulating firearms.and saving lives.
Now I need to go back and clean up six hubs and finish adding to the Table in Part 1 the raw data I used in this effort, now that I know what it is.

