ArtsAutosBooksBusinessEducationEntertainmentFamilyFashionFoodGamesGenderHealthHolidaysHomeHubPagesPersonal FinancePetsPoliticsReligionSportsTechnologyTravel

Let Me Take You Where the (UFO) Action Is..

Updated on March 28, 2015
retrojoe profile image

MUFON UFO Journal author (March 1995, June 1996). Self published on UFO Window website from 1997 to 2002. Hubpages articles began late 2011.

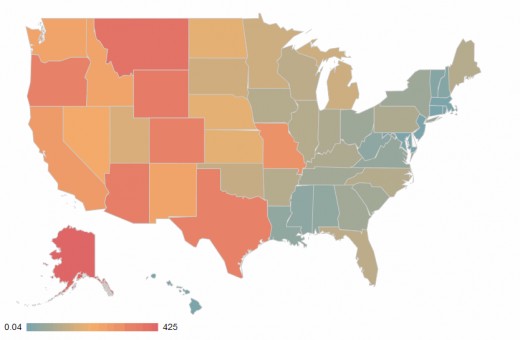
At last check, the United States was in above average viewing mode for UFOs. Well, at least for the western half of America (as can be seen from the opening visual aid). In the leading map of the U.S. the red, orange, and pale orange hued states are getting well over what is average for a U.S. state (factoring in state population and area in square miles). States like North Dakota and Indiana (of a dirty gold or tarnished brass color) are average and states like Illinois, Indiana, Ohio and West Virginia are below average (of an olive color and light or grayish shades of blue green).

This map is the result of my investigating UFO sightings for the last half of 2011, gleaned from both the Mutual UFO Network (MUFON) and the National UFO Reporting Center (NUFORC) raw data. My interest in this period is not just because it is looking at the latest data, but also because this period is a record setter. It is likely the highest concentration of sightings in a six month period since the 1970s. Looking at sightings for last year (see graphic below) and comparing the monthly totals of NUFORC data for 2011 (bar graph) to the average monthly values for the previous ten years (line graph), we see that most of the months in the last half of 2011 were exceptionally big ones.

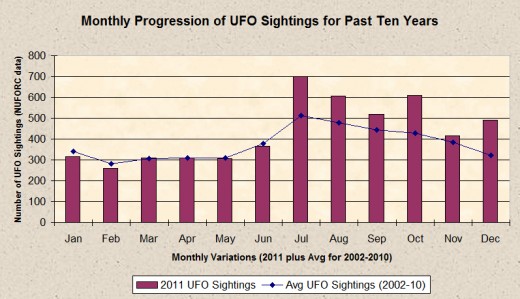
Looking again at the NUFORC data, starting out in July, we have the second biggest UFO sightings month of all time (only surpassed by a July two years earlier). This is followed by records set in August, October, December and January (2012). August was not only the biggest August in at least the last eleven years (and likely the past 30 years), but the third highest of any month ever. Similarly, October was the biggest October ever and the fourth highest month on record. December, usually the slowest month of the year, had it's biggest December for sightings ever and it was the only time a December made it into the top 50 months of all time. Although December places second to last out of the last six months of 2011, it is the highest month when looking at how many times it was above its average (1.55Xs compared to 1.42Xs for October, 1.37Xs for July, and 1.27Xs for August). What that may indicate is that December could likely have been when a present wave of activity peaked and that things should begin to wind down at this point but, at the same time, it should probably take a few more months for things to get back to normal (unless there is another wave due in the coming summer months). The first month of this year got off to an intense start with a record number of sightintgs on the 1st of the month as well as the last day of the prior year. Both December 2011 and January 2012 registered about 500 sightings by NUFORC and were the highest totals for those two months on record there (January also had 1.49Xs more sightings than is average for that month or very close to December's 1.55Xs its average).

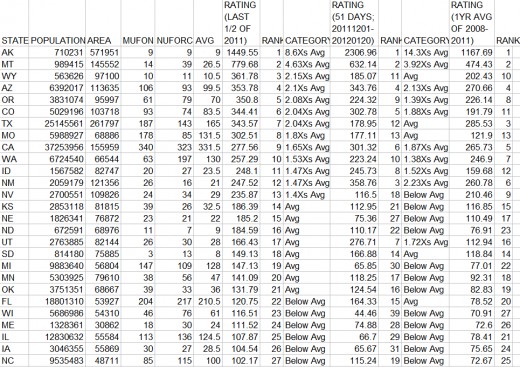
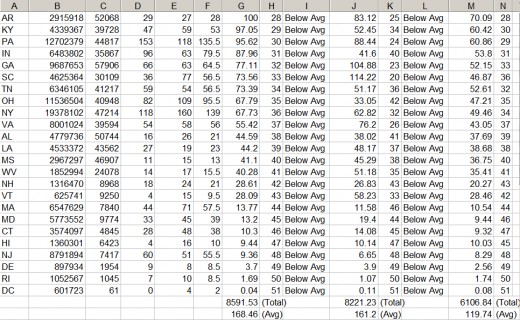
In an earlier hub (Where to Really Go to See UFOs) I tried to give a better determination of what states were the best to see a UFO than one could get from MUFON's monthly UFO report totals by state. I think I did a good job but realized lately that I could probably do better. My reasoning is due to the fact that when one looks at just a month or two of data, it is hard to get a precise read on the status of sightings in states with small populations and thus a small number of sightings as well. At least in those areas, the bigger the pool of data the better. This time I expanded current sightings from 51 days to 6 months. In the spreadsheet illustration below you can see how it gives a better representation in most cases of these smaller states. Wyoming for example moved from 11th to 3rd place in the rankings, giving what I believe is a more accurate view of the situation there (mostly due I feel to the greater amount of data). Conversely, New Mexico went from 3rd to 12th place (practically switching places with Wyoming). This is partly due to there being such a big difference between the sighting numbers between the two sources (again this kind of thing happens more often in the states with smaller populations/sighting totals). There were big differences in the two sources of data with larger states as well, however. MUFON had more than twice as many reports for Missouri as NUFORC did (perhaps because that state is closer to MUFON's Texas state headquarters). Looks like Missouri had a major flap in early October, racking up 46 sightings in 5 days. The resulting high number of sightings for the period studied caused that state to jump from 13th to 8th place on the list. Another success story is Texas, moving from 12th to 7th place. Both these last two states had been ranked as average by me earlier but moved up into the significantly above average category.

© 2012 Joseph Ritrovato

working

This website uses cookies

As a user in the EEA, your approval is needed on a few things. To provide a better website experience, hubpages.com uses cookies (and other similar technologies) and may collect, process, and share personal data. Please choose which areas of our service you consent to our doing so.

For more information on managing or withdrawing consents and how we handle data, visit our Privacy Policy at: https://corp.maven.io/privacy-policy

Show Details
Necessary
HubPages Device IDThis is used to identify particular browsers or devices when the access the service, and is used for security reasons.
LoginThis is necessary to sign in to the HubPages Service.
Google RecaptchaThis is used to prevent bots and spam. (Privacy Policy)
AkismetThis is used to detect comment spam. (Privacy Policy)
HubPages Google AnalyticsThis is used to provide data on traffic to our website, all personally identifyable data is anonymized. (Privacy Policy)
HubPages Traffic PixelThis is used to collect data on traffic to articles and other pages on our site. Unless you are signed in to a HubPages account, all personally identifiable information is anonymized.
Amazon Web ServicesThis is a cloud services platform that we used to host our service. (Privacy Policy)
CloudflareThis is a cloud CDN service that we use to efficiently deliver files required for our service to operate such as javascript, cascading style sheets, images, and videos. (Privacy Policy)
Google Hosted LibrariesJavascript software libraries such as jQuery are loaded at endpoints on the googleapis.com or gstatic.com domains, for performance and efficiency reasons. (Privacy Policy)
Features
Google Custom SearchThis is feature allows you to search the site. (Privacy Policy)
Google MapsSome articles have Google Maps embedded in them. (Privacy Policy)
Google ChartsThis is used to display charts and graphs on articles and the author center. (Privacy Policy)
Google AdSense Host APIThis service allows you to sign up for or associate a Google AdSense account with HubPages, so that you can earn money from ads on your articles. No data is shared unless you engage with this feature. (Privacy Policy)
Google YouTubeSome articles have YouTube videos embedded in them. (Privacy Policy)
VimeoSome articles have Vimeo videos embedded in them. (Privacy Policy)
PaypalThis is used for a registered author who enrolls in the HubPages Earnings program and requests to be paid via PayPal. No data is shared with Paypal unless you engage with this feature. (Privacy Policy)
Facebook LoginYou can use this to streamline signing up for, or signing in to your Hubpages account. No data is shared with Facebook unless you engage with this feature. (Privacy Policy)
MavenThis supports the Maven widget and search functionality. (Privacy Policy)
Marketing
Google AdSenseThis is an ad network. (Privacy Policy)
Google DoubleClickGoogle provides ad serving technology and runs an ad network. (Privacy Policy)
Index ExchangeThis is an ad network. (Privacy Policy)
SovrnThis is an ad network. (Privacy Policy)
Facebook AdsThis is an ad network. (Privacy Policy)
Amazon Unified Ad MarketplaceThis is an ad network. (Privacy Policy)
AppNexusThis is an ad network. (Privacy Policy)
OpenxThis is an ad network. (Privacy Policy)
Rubicon ProjectThis is an ad network. (Privacy Policy)
TripleLiftThis is an ad network. (Privacy Policy)
Say MediaWe partner with Say Media to deliver ad campaigns on our sites. (Privacy Policy)
Remarketing PixelsWe may use remarketing pixels from advertising networks such as Google AdWords, Bing Ads, and Facebook in order to advertise the HubPages Service to people that have visited our sites.
Conversion Tracking PixelsWe may use conversion tracking pixels from advertising networks such as Google AdWords, Bing Ads, and Facebook in order to identify when an advertisement has successfully resulted in the desired action, such as signing up for the HubPages Service or publishing an article on the HubPages Service.
Statistics
Author Google AnalyticsThis is used to provide traffic data and reports to the authors of articles on the HubPages Service. (Privacy Policy)
ComscoreComScore is a media measurement and analytics company providing marketing data and analytics to enterprises, media and advertising agencies, and publishers. Non-consent will result in ComScore only processing obfuscated personal data. (Privacy Policy)
Amazon Tracking PixelSome articles display amazon products as part of the Amazon Affiliate program, this pixel provides traffic statistics for those products (Privacy Policy)
ClickscoThis is a data management platform studying reader behavior (Privacy Policy)