- HubPages»
- Sports and Recreation»
- Team Sports»
- American Football»
- NFL Football
Seahawks Defied statistics with win over Vikings. Analytics Alert!

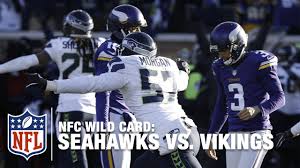
We all saw what happened. I jumped up and said "Oh my gosh!" over and over and over. I couldn't believe it. Blair Walsh, a newcomer to the "household name" crew, and a newcomer to the "NFL infamy" club missed a short field goal to lose the game and send Seattle to the second round of the playoffs, and send the Minnesota Vikings to one of their famous boat parties. (If you don't know that reference, google Vikings sex boat, that should clear it up).
So I'm gonna look at a different side of this game and even in the moment I thought Pete Carroll made a horrible decision and I think he may have set some teams back with his incorrect decision working out.
So here is the scenario. Late in the 4th quarter, Kyle Rudolph makes a catch, breaks a tackle, and streaks down the sideline and is knocked out of bounds at the 20 yard line with 1:26 to go. Both teams have two timeouts, and Seattle leads 10-9. The Vikings then run the ball 3 times in a row, getting the ball to just outside the 10 yard line, just short of a first down. Seattle is forced to use their last two timeouts, and then watch the clock run down to 26 seconds before the Vikings call timeout in order to set up the go ahead field goal. Obviously the field goal was missed and Seattle won the game.
How do I think Pete Carroll messed up? Because he didn't use analytics in that spot. In my opinion, and I believe the stats will back it up, I believe he should have let the Vikings score and tried to score a touchdown to tie it or win it. And the hardest part, when thinking about the first sentence of this paragraph is to think that he made the wrong decision. HE WON THE GAME HOW COULD HE HAVE MADE THE WRONG DECISION??? Because analytics doesn't look at one instance or one trial, it looks at 100 or 1000 when making a decision. A quick example. If I go on the basketball court and shoot with my off hand with my eyes closed and it goes in, does that mean I should start shooting with my off hand and my eyes closed? No. Maybe it went in that one time, but it is a losing play over time.
We have seen it so many times, a team is tied, down by 1 or 2, and runs down the clock and kicks a field goal to win the game. The defense is powerless and the coach is powerless as they watch the game slip away. The same scenario happened in the game Sunday. The Seahawks looked on as the Vikings prepared to beat them with a final field goal as they sat with a 1 point lead. So in the moment, I felt like they should let the Vikings score and take their chances driving down and scoring a touchdown.
First of all, if they had let the Vikings score on the next play, they would have approximately 1:20 on the clock with 2 timeouts. Because they were up one, a touchdown puts the Vikings up by 5 and of course they would go for a 2 point conversion. So worst case scenario, they need a touchdown to tie and go to overtime, and best case a touchdown wins the game (if they stopped the 2 point conversion).
So lets get the analytical part where I felt Pete Carroll made a mistake.
On the season, field goal kickers, on field goals from 20-29 yards (it was a 27 yarder) were 231-238 which is 97.0%. Only 7 were missed the whole season! So when working with analytics we want to work out of a scale of 100. So based on a league average, the Vikings would make it 97 of 100 times. Oh and by the way, Blair Walsh himself was 10-10 from that range. Now, factoring the weather being so cold, lets say he makes it 96 of 100 even though I think its higher than that realistically. Now we aren't done yet. How many times out of 100 is there a bad snap or bad hold, lets add 1 for that. And how about they block the field goal? I couldn't find the league numbers on that but I found that Seattle hasn't blocked a field goal this year or last year. So we will add one time out of 100 for that. Next, the Vikings, on running it on first, second, and third down could fumble the ball. Lets say that happens 2 out of 100 times as well. At this point we are at 92 times out of 100 the Vikings take the lead. Finally, Seattle coming the other way and scoring either a touchdown or field goal to win the game. They would have 22 seconds and no timeouts. I mean this is so tough. They would have to get either one huge play to the middle and spike, or a couple shorter out of bounds and then throw up a hail mary. Unless the Vikings made a massive mistake, I don't think its possible to get to field goal range in that time. I think best case is to get one 25-30 yard gain over the middle to get to mid field. Run up and spike it and take one shot at the end zone. Lets give them 2 chances out of 100 of them winning the game with 22 seconds left in that spot. There we go, the Vikings win the game 90 out of 100 times in that spot in my opinion, give or take a tiny bit. If someone wants to argue one of those points I am open to listen to counters.
So lets pretend that Pete Carroll let them score on the next play. I believe the Seahawks would have right around 1:20 and down by 6 or 7 with 2 timeouts. Again lets look at it analytically. First of all, the two point conversion for the Vikings is huge. Why? Because if they don't make the two point conversion, then in a 100 test sample, every time the Seahawks score a touchdown, they win the game. If the Vikings make the two point conversion, then some of the time that Seattle scores the touchdown to tie, they still will lose the game in overtime. The math on that would get really confusing, so lets just talk about not losing in regulation.
So the last piece of this puzzle is this, how many times out of 100 would the Seahawks score a touchdown with 1:20 to go and two timeouts. If that answer is more than 10, then the Seahawks correct play was to let the Vikings score. So what do we say? The best I could find was the percent of scoring from every spot on the field with 2 minutes to go. So of course we have to lower the chances because it was less time. The graph I found doesn't say how many timeouts are left. It just shows the percent that teams scored a td with 2 minutes to go from each part of the field this season. Lets now say the ball was on Seattle's 20, which I would say is average, the graph shows about 32% of the time the team scores a touchdown. It also says its when a team needs a td, so that discludes first halves. I'm guessing its not playoffs so that of course lowers the number a bit because the season doesn't end during the season if the other team scores to win. The number would also be lower based on the weather in Minnesota that day, and Seattle struggling to move the ball against the Vikings defense. With two timeouts, knowing they have 4 downs, and with the season on the line, I would say they score somewhere between 18-20 times per 100. Maybe that is high to some people based on the flow of the game, but I believe the number is significantly higher than 10% (and don't forget I think 10% was very generous on the other side).
So I believe that the way it happened, Seattle wins the game 10 out of 100 times, and had they let the Vikings score, they score a touchdown 18-20 out of 100 times, therefore, I believe that Pete Carroll made the wrong decision in hoping they missed the chip shot field goal.
Moving forward I think this sets analytical coaching back. Why? Because everyone will remember this play, and so will the coaches. How many of them think from a numbers perspective? Not many. John Gruden just came out saying, "I don't need analytics I have my eyes to see," and that was in reference to the Cleveland Browns hiring a baseball numbers guy to try and help turn that franchise around. And lets think about it. This upcoming weekend for example, say the Patriots are down by 2 as time winds down for a game winning field goal. Will you not be thinking and talking about Blair Walsh's miss? The announcers will probably say something like, "after Seattle's win last weekend, nothing is a sure thing," and the coaching staff of both teams will be thinking about it. And the coach of the team that is about to lose will be thinking about Walsh and how there is still a chance. And even next year, that kick will probably be referenced as how your never out of it or some other cliche line.
But the numbers say you will lose. The numbers say its the wrong play. But every 60+ year old person, and every person that doesn't think analytics mean anything will say, "Ya but they could miss" or even better, "the numbers said that was wrong, but for the Vikings it was right." And what they don't understand, and why I love math and numbers, is because the numbers are always right.


