- HubPages»
- Technology»
- Computers & Software»
- Computer Science & Programming»
- Programming Languages
Animating Bezier Curves with Javascript and JQuery - part 3 in a series

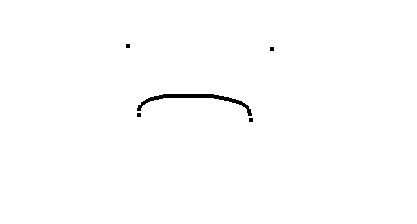
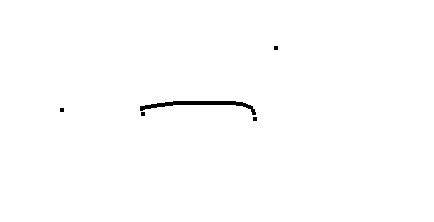
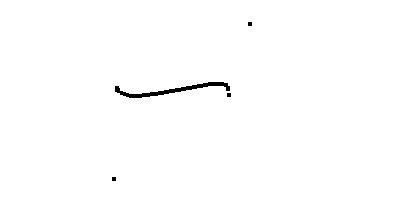
draw a curve and then move its control points interactively
descussion of animation with jQuery
We have finally gotten to the point where jQuery really shines. Using jQuery, animating the changes to the Bezier Curve as the user drags the control points around, just required a few additions to the function that graphs the Bezier Curve, jgbezier. While the topic of Bezier Curves may seem archane, the same techniques are useful for more typical widgets that one might want to provide for a user interface.
In order to animate the generation of the curve, there is some information I need to track. First, I need to know which of the points the user clicked on and is dragging. Second, I need to keep track of the elements that make up the old curve, so that, I can erase them and draw the new curve.
I accomplish the first by assigning an id to the DOM element corresponding to each of the four points that the user selected. $( rect ).attr( "id", "bcctl_" + bpointcnt ); I can then retrieve this id in the mousedown event handler: var myid = $( movetarget ).attr( "id" );
I accomplish the second by tagging the elements that make up the curve I have just drawn with a class name. I tag all black rectangles that exist before the curve is drawn with the class, oldrectangle. $( ".blackrectangle" ).addClass( "oldrectangle" );
This includes the control points for the curve, but could conceivably also include a previous graph. After the curve is drawn, I tag all blackrectangles with the class, newrectangle. When I remove "newrectangle" from all of the elements tagged with "oldrectangle", this leaves precisely the elements of the curve that I just drew as members of the newrectangle class. $( ".blackrectangle" ).addClass( "newrectangle" ); $( ".oldrectangle" ).removeClass( "newrectangle" );
On the next iteration, I remove all newrectangles before drawing the next new curve. $( ".newrectangle" ).remove();
There are a few tricks worth mentioning to the animation itself. I associate the mousedown event with the most specific objects possible, the individual control points. However, I associate the dragging (mousemove and mouseup) with the most general possible element, body. This is because it is easy for the mouse to slip out of the control point elements and for these events to go to other objects. Once, I receive the mousedown, I know the user's intention, and drag the point until there is a mouseup.
There is a variable "drawing" which I use to prevent starting to draw one iteration of the curve while another is still in progress. Mousemove events are very frequent, and the calculation of the curve is complex enough that it is quite possible to fall behind. Drawing multiple curves simultaneously would just get us further behind, not to mention, mess up my algorithm for tracking the elements that make up the curve. If I were really interested in smooth motion animation, I would optimize this code so that it never fell behind; a very difficult goal given the relationship of javascript to the browser. So, I'll give myself a feasible goal of a working animation that sometimes moves a little jerkily.
I changed all references to clientX and clientY to pageX and pageY, because jQuery normalizes those properties across browsers.
It is now time to answer the question of what jQuery has really done for me. First it has given me a compact and intuitive interface for manipulating DOM elements. Second, it provides some insulation from browser variations. I think for those two things, it is well worth the extra download of the jquery library file while my page is loading.
It is true I could do the same thing in other ways. I could build my own data structure for tracking the elements that make up my animation, and I could manipulate the DOM with native browser interfaces. However, that would be a lot more code than what I have written here, and it would be pretty ugly and browser dependent code. I'm perfectly happy to leave all that ugliness to jQuery. This moral applies to a lot of user interface work that one might want to do in a browser.
the Bezier Curve drawing function with animation added
function jgbezier ( drawarea ) {
	var bpoints = new Array();
	var bpointcnt = 0;
	unitsquare.dontscale = true;
	$( "#mousetarget" ).bind( "click", function (e) {
		if( bpointcnt < 4 ) {
			var rect = drawrectangle( "blackrectangle", e.pageY + 2, e.pageX - 2, 4, 4 );
			$( rect ).attr( "id", "bcctl_" + bpointcnt );
			bpoints[bpointcnt] = drawarea.screenCoordinatesToPoint( e.pageX, e.pageY );
			++bpointcnt;
			if( bpointcnt == 4 ) {
				// mark what is already here
				$( ".blackrectangle" ).addClass( "oldrectangle" );
				// attach mouse handlers
				$( "#mousetarget" ).remove();
				var drawing = false;
				$( ".blackrectangle" ).bind( "mousedown", function ( e ) {
					var movetarget = this;
					$( "body" ).bind( "mousemove", function ( e ) {
						$( movetarget ).css( "top", e.pageY + 2 );
						$( movetarget ).css( "left", e.pageX - 2 );
						var myid = $( movetarget ).attr( "id" );
						var myindex = parseInt( myid.substr( 6 ) );
						bpoints[ myindex ] = drawarea.screenCoordinatesToPoint( e.pageX, e.pageY );
						if( !drawing ) {
							drawing = true;
							drawbcurve();
							// mark the new points
							drawing = false;
						}
					} );
				});
				$( "body" ).bind( "mouseup", function ( e ) {
					$( "body" ).unbind( "mousemove" );
					drawbcurve();
				});
				//draw curve
				var drawbcurve = function () {
					// remove old curve
					$( ".newrectangle" ).remove();
					var xpath = genbezierequation( bpoints[0].x, bpoints[1].x - bpoints[0].x, bpoints[2].x, bpoints[2].x - bpoints[3].x );
					var ypath = genbezierequation( bpoints[0].y, bpoints[1].y - bpoints[0].y, bpoints[2].y, bpoints[2].y - bpoints[3].y );
					$( "#xformula" ).attr( "value", xpath );
					$( "#yformula" ).attr( "value", ypath );
					$( "#jgmeshstart" ).attr( "value", '0' );
					$( "#jgmeshend" ).attr( "value", '1' );
					$( "#start_calc" ).trigger( "click" );
					// mark the new points
					$( ".blackrectangle" ).addClass( "newrectangle" );
					$( ".oldrectangle" ).removeClass( "newrectangle" );
				}
				drawbcurve();
				// mark the new points
				$( ".blackrectangle" ).addClass( "newrectangle" );
				$( ".oldrectangle" ).removeClass( "newrectangle" );
			}
		}
	});
}
complete source code
<html>
<head>
<title>Javascript based graphing calculator</title>
<style type="text/css" >
.whiterectangle { color: white; background-color: white; z-index: 0;}
.blackrectangle { color: black; background-color: black; z-index: 1;}
.tmpblackrectangle { color: black; background-color: black; z-index: 1;}
.jgdialog { position: absolute; top:0; left:460; z-index:1; }
.mousetarget { position: absolute; top:50; left:50; z-index: 2; opacity: "0%"; cursor:pointer; }
</style>
<!--<script type="text/javascript" src="http://ajax.googleapis.com/ajax/libs/jquery/1.4.4/jquery.min.js"></script>-->
<script type="text/javascript" src="./js/jquery-1.4.2.min.js"></script>
<script type="text/javascript" >

var allowedFunctions = new Array();
allowedFunctions[ "E" ] = "Math.E";
allowedFunctions[ "PI" ] = "Math.PI";
allowedFunctions[ "*" ] = "*";
allowedFunctions[ "+" ] = "+";
allowedFunctions[ "-" ] = "-";
allowedFunctions[ "/" ] = "/";
allowedFunctions[ "x" ] = "x";
allowedFunctions[ "cos" ] = "Math.cos";
allowedFunctions[ "sin" ] = "Math.sin";
allowedFunctions[ "tan" ] = "Math.tan";
allowedFunctions[ "acos" ] = "Math.acos";
allowedFunctions[ "asin" ] = "Math.asin";
allowedFunctions[ "atan" ] = "Math.atan";
allowedFunctions[ "exp" ] = "Math.exp";
allowedFunctions[ "ln" ] = "Math.log";
allowedFunctions[ "pow" ] = "Math.pow";
allowedFunctions[ "," ] = ",";
allowedFunctions[ "sqrt" ] = "Math.sqrt";
allowedFunctions[ "" ] = "";

function loadinputdata()
{
	var yfn = getinputparam( "yformula", "x*x" );
	var xfn = getinputparam( "xfromula", "x" );
	document.forms[ "jg_input" ].elements[ "yformula" ].value = unescape(yfn);
	document.forms[ "jg_input" ].elements[ "xformula" ].value = unescape(xfn);
}

function getinputparam( pname, def )
{
	var tmpStr, tmpInt, pend, rval;

	rval = def;
	tmpStr = window.location.search.substring(1);
	tmpInt = tmpStr.indexOf( pname );
	if( tmpInt != -1 ) {
		tmpStr = tmpStr.substr( pname.length + 1 );
		pend = tmpStr.indexOf( "&" );
		if( pend >= 0 ) {
			rval = tmpStr.substr( 0, pend );
		} else {
			rval = tmpStr;
		}
	}
	return( rval );
}


var jgpointbase = {
	x: 0,
	y: 0
};

var msize = 0.1;

function jgpoint( ) {
	this.prototype = jgpointbase;
	//this.x = x;
	//this.y = y;
};

function jgptsc( x, y ) {
		var rval = new jgpoint( );
		rval.x =  this.screenx0 + (( this.screenx1 - this.screenx0 ) / ( this.x1 - this.x0 )) * ( x - this.x0 );
		rval.y =  this.screeny0 + (( this.screeny1 - this.screeny0 ) / ( this.y1 - this.y0 )) * ( y - this.y0 );
		return( rval );
}

function scjgpt( sx, sy ) {
	var rval = new jgpoint();
	rval.x = this.x0 + (( this.x1 - this.x0 )/(this.screenx1 - this.screenx0)) * ( sx - this.screenx0 );
	rval.y = this.y0 + (( this.y1 - this.y0 )/(this.screeny1 - this.screeny0)) * ( sy - this.screeny0 );
	return( rval );
}

var jgcoordinatesbase = {
	x0: -1.25,
	screenx0: 50,
	y0: -1.25,
	screeny0: 450,
	x1: 1.25,
	screenx1: 450,
	y1: 1.25,
	screeny1: 50,
	dontscale: false,
	pointToScreenCoordinates: jgptsc,
	screenCoordinatesToPoint: scjgpt,
	scaleToCurve: function ( curvefn, fnstart, fnstop, delta ) {
		var pt;
		var fofpt;

		if( this.dontscale ) {
			return;
		}
		// get maximum and minimum x and y values
		fofpt = curvefn( fnstart );
		var minx = fnstart;
		var miny = fofpt.y;
		var maxx = fnstop;
		var maxy = fofpt.y;
		for( pt = fnstart + delta ; pt < fnstop; pt += delta ) {
			fofpt = curvefn( pt );
			if( fofpt.y > maxy ) {
				maxy = fofpt.y;
			}
			if( fofpt.y < miny ) {
				miny = fofpt.y;
			}
		}
		var aspectratio = ( this.y1 - this.y0 ) / ( this.x1 - this.x0 );
		if( this.y0 < miny ) {
			miny = this.y0;
		}
		if( this.y1 > maxy ) {
			maxy = this.y1;
		}
		if( this.x0 < minx ) {
			minx = this.x0;
		}
		if( this.x1 > maxx ) {
			maxx = this.x1;
		}
		var newaspectratio = ( maxy - miny ) / (maxx - minx );
		if( newaspectratio > aspectratio ) {
			// match y values and scale x values
			this.y0 = miny;
			this.y1 = maxy;
			var xlength = 1 / aspectratio * ( maxy - miny );
			this.x0 = minx + (maxx - minx) / 2 - xlength / 2;
			this.x1 = minx + (maxx - minx) / 2 + xlength / 2;
		} else {
			// match x values and scale y values
			this.x0 = minx;
			this.x1 = maxx;
			var ylength = aspectratio * ( maxx - minx );
			this.y0 = miny + (maxy - miny) / 2 - ylength / 2;
			this.y1 = miny + (maxy - miny) / 2 + ylength / 2;
		}
		if ( this.x0 < 0 && this.x1 > 0 ) {
			var yaxis1 = this.pointToScreenCoordinates( 0, this.y1 );
			var yaxis0 = this.pointToScreenCoordinates( 0, this.y0 );
			drawline( 1, yaxis0.x, yaxis0.y, yaxis1.x, yaxis1.y );
		}
		if( this.y0 < 0 && this.y1 > 0 ) {
			var xaxis1 = this.pointToScreenCoordinates( this.x1, 0 );
			var xaxis0 = this.pointToScreenCoordinates( this.x0, 0 );
			drawline( 1, xaxis0.x, xaxis0.y, xaxis1.x, xaxis1.y );
		}

	}
};

function jgcoordinates() {
}

jgcoordinates.prototype = jgcoordinatesbase;


function drawrectangle( myclass, top, left, width, height )
{
	var bodylist = document.getElementsByTagName( "body" );
	var rect = document.createElement( "div" );
	var mystyle = 'position:absolute;top:' + top + ";left:" + left + ';width:' + width + ";height:" + height;
	rect.setAttribute( "class", myclass );
	rect.setAttribute( "style", mystyle );
	bodylist[0].appendChild( rect );
	return( rect );
}

function drawline( width, x1, y1, x2, y2 )
{
	var x, y, nexty, nextx;
	x1 = Math.round( x1 );
	y1 = Math.round( y1 );
	x2 = Math.round( x2 );
	y2 = Math.round( y2 );
	// ensure x1, y1 is leftmost point
	if( x1 > x2 ) {
		tmp = x2;
		x2 = x1;
		x1 = tmp;
		tmp = y2;
		y2 = y1;
		y1 = tmp;
	}
	var dx = x2 - x1;
	var dy = y2 - y1;

	if( dy == 0 ) { // horizontal line
		drawrectangle( "blackrectangle", y1 - width / 2, x1, dx, width );
		return;
	} else if ( dx == 0 ) { // vertical line
		if( dy < 0 ) {
			y1 = y2;
			dy = -dy;
		}
		drawrectangle( "blackrectangle", y1, x1 - width / 2, width, dy );
		return;
	}
	var slope = dy / dx;
	if( slope > 1 || slope < -1 ) {
		// one x per multiple y
		if( y1 < y2 ) {
			y = y1;
			for( x = x1 ; x < x2 ; x += 1 ) {
				nexty = y + slope;
				drawrectangle( "blackrectangle", y, x - width / 2, width, nexty - y );
				y = nexty;
			}
		} else {
			y = y1;
			for( x = x1 ; x < x2 ; x += 1 ) {
				nexty = y + slope;
				drawrectangle( "blackrectangle", nexty, x - width / 2, width, y - nexty );
				y = nexty;
			}
		}

	} else {
		// one y per multiple x
		if( y1 < y2 ){
			x = x1;
			for( y = y1 ; y < y2 ; y += 1 ) {
				nextx = x + 1 / slope;
				drawrectangle( "blackrectangle", y - width / 2, x, nextx - x, width );
				x = nextx;
			}
		} else {
			x = x2;
			for( y = y2 ; y < y1 ; y += 1 ) {
				nextx = x + 1 / slope;
				drawrectangle( "blackrectangle", y - width / 2, nextx, x - nextx, width );
				x = nextx;
			}
		}
	}


}

function jgcircle( angle ) {
	var rval = new jgpoint();

	rval.x = Math.cos( angle );
	rval.y = Math.sin( angle );
	return( rval );
}

function jgcos1overx2( x ) {
	var rval = new jgpoint();

	rval.x = x;
	rval.y = Math.cos( 1 / ( x * x ) );
	return rval;
}

function jgptdiff( fn, x, delta ) {
	var rval = new jgpoint();

	rval.x = x;
	rval.y = -( fn( x ).y - fn( x + delta).y) / ( delta );
	//bit of a hack to keep the integration function from reseting
	return( rval );
}

function jgdiff( fn, delta ) {
	var rval = function( x ) {
		return jgptdiff( fn, x, delta );
	}
	return rval;
}

function jgptint( fn, x, delta ) {
	var rval = new jgpoint();

	rval.x = x;
	rval.y = fn( x - delta ).y * delta;
	return( rval );
}

function jgint( fn, delta ) {
	var sum = 0;
	var lastx = 1000;
	var rval = function( x ) {
		if( x < lastx ) {
			// assume new integral, reset
			sum = 0;
		} else {
			delta = x - lastx;
		}
		var pt = jgptint( fn, x, delta );
		sum += pt.y;
		pt.y = sum;
		lastx = x;
		return( pt );
	}
	return rval;
}

function xsquared( x ) {
	var rval = new jgpoint();

	rval.x = x;
	rval.y = x * x;
	return( rval );
}


function drawcurve( curvefn, coord, fnstart, fnstop, delta ) {
	var pt;
	var fofpt;
	var screenpt, newscreenpt;

	fofpt = curvefn( fnstart );
	screenpt = coord.pointToScreenCoordinates( fofpt.x, fofpt.y );
	for( pt = fnstart + delta ; pt < fnstop ; pt += delta ) {
		fofpt = curvefn( pt );
		newscreenpt = coord.pointToScreenCoordinates( fofpt.x, fofpt.y );
		if( screenpt.x != newscreenpt.x || screenpt.y != newscreenpt.y ) {
			drawline( 4, screenpt.x, screenpt.y, newscreenpt.x, newscreenpt.y );
			screenpt = newscreenpt;
		}
	}
}

function makefn( formula ) {
	var rfn = function( x ) {
		var rval = eval( formula + ";" );
		return rval;
	}
	return rfn;
}

function makepathfn( xfn, yfn ) {
	var rfn = function ( t ) {
		var pt = new jgpoint();

		pt.x = xfn( t );
		pt.y = yfn( t );
		return( pt );
	}
	return rfn;
}

function diff( exp ) {

	var xfn = makefn( "x" );
	var yfn = makefn( exp );
	var pfn = makepathfn( xfn, yfn );
	var dfn = jgdiff( pfn, msize );
	var rfn = function ( x ) {
		var pt = dfn( x );
		return( pt.y );
	}
	return( rfn );
}

function integrate( exp ) {

	var xfn = makefn( "x" );
	var yfn = makefn( exp );
	var pfn = makepathfn( xfn, yfn );
	var dfn = jgint( pfn, msize );
	var rfn = function ( x ) {
		var pt = dfn( x );
		return ( pt.y );
	}
	return( rfn );
}

var integratex = integrate( "x" );
var differentiatex = diff( "x" );
var generatedfn = Array();
var gencount = 0;

function parseeq( eq ){
	var pat = new RegExp( "^\\s*([a-zA-Z0-9._]+)\\s*(\\S?)(.*)");
	var pata = new RegExp( "^\\s*(\\S?)(.*)" );
	//var pat = new RegExp( "\s*([a-zA-Z0-9\._]+)\s*([+*/\-\x28\x29])(.*)");
	var pat2 = new RegExp( "\\s*([^\\s])(.*)");
	var pat3 = new RegExp( "([a-zA-Z0-9_.]+)" );
	var pat4 = new RegExp( "[0-9]*\\.?[0-9]*" );
	var neweq = "";
	var match;
	var match2;
	var rval = Array();
	var subeq;
	var oplist = ")-+*/,";
	var op,term;
	var lasteq ="";

	while( eq.length > 0 && eq != lasteq ) {
		lasteq = eq;
		//check for bare paren
		match = pata.exec( eq );
		if( match && match[1] == "(" ) {
			match[3] = match[2];
			match[2] = match[1];
			match[1] = "";
		} else if ( match && match[1] == "-" ) {
			//unitary minus
			match[3] = match[2];
			match[2] = match[1];
			match[1] = "";
		} else {
			match = null;
		}
		if( !match ) {
			match = pat.exec( eq );
		}
		if ( !match || match.length < 1 || match[2] == "" ) {
			// could be the last term
			match2 = pat3.exec( eq );
			if( match2 ) {
				if ( allowedFunctions[ match2[1] ] != undefined ) {
					neweq += allowedFunctions[ match2[1] ];
				} else if ( pat4.exec( match2[1] ) ) {
					// term is a constant
					neweq += match2[1];
				} else {
					alert( match2[1] + "is not a supported function, or constant" )
				}
			} else if ( eq.indexOf( ")" ) >= 0 ) {
				neweq += ")";
			} else {
				alert( "Bad syntax: " + eq );
			}
			rval[0] = neweq;
			rval[1] = "";
			return( rval );
		}
		term = match[1];
		//alert( term );
		if( match[2] == "" ) {
			// make the re work the way I want
			match[2] = match[3].charAt(0);
			match[3] = match[3].substr(1);
		}
		op = match[2];
		if( op != "(" ) {
			if ( allowedFunctions[ term ] != undefined ) {
				neweq += allowedFunctions[ term ] + op;
			} else if ( pat4.exec( term ) ) {
				// term is a constant
				neweq += term + op;
			} else {
				alert( term + "is not a supported function, or constant" )
			}

		}

		while( op != "" ) {
			if( op == "(" ) {
				subeq = parseeq( match[3] );
				if( term == "D" ) {
					// create path deriviative function, and name it
					var fn = diff( op + subeq[0] );
					generatedfn[ gencount ] = fn;
					// use created name in expression
					neweq += "generatedfn[" + gencount + "](x)";
					++gencount;
				} else if( term == "S" ) {
					// create path deriviative function, and name it
					var fn = integrate( op + subeq[0] );
					generatedfn[ gencount ] = fn;
					// use created name in expression
					neweq += "generatedfn[" + gencount + "](x)";
					++gencount;
				} else if ( allowedFunctions[ term ] != undefined ) {
					neweq += allowedFunctions[ term ] + op;
					neweq += subeq[ 0 ];
				} else {
					alert( term + " is not a supported function" );
				}
				// continue with unmatched part
				eq = subeq[1];
				match2 = pat2.exec( eq );
				rval[0] = neweq;
				rval[1] = eq;
				if( match2 ) {
					// first non-white character should be an operator
					op = match2[1];
					eq = match2[2];
					match[3] = eq;
					neweq += op;
				} else {
					op = "";
				}
			} else if( op == ")" ) {
				rval[0] = neweq;
				rval[1] = match[3];
				return( rval );
			} else if( op == "" ) {
				// we're done
				rval[0] = neweq;
				rval[1] = match[3];
				eq = "";
				op = "";
			} else if( oplist.indexOf( op ) ) {
				rval[0] = neweq;
				rval[1] = match[3];
				eq = match[3];
				op = "";
			} else{
				alert( "Bad syntax: " + eq );
				rval[0] = "";
				rval[1] = "";
				return( rval );
			}
		}
	}

	return rval;
}

function genbezierequation( x0, fx0, x1, fx1 ){
	var a;
	var b;
	var c;
	var d;

	a = x0;
	b = fx0;
	c =  -3 * x0 - 2 * fx0 + 3 * x1 - fx1;
	d = fx1 - 2 * x1 + 2 * x0 + fx0;

	var rval = a + " + x * " + b +  " + x * x * " + c + " + x * x * x * " + d;
	return( rval );
}

function jggraph( coord ) {
	var xformula = document.forms[ "jg_input"].elements[ "xformula" ].value; //"x*x;";
	var yformula = document.forms[ "jg_input"].elements[ "yformula" ].value; //"x;";
	var eq;

	eq = parseeq( yformula );
	yformula = eq[0];

	var xfn = makefn( xformula );
	var yfn = makefn( yformula );
	var pfn = makepathfn( xfn, yfn );

	var mstart = parseFloat(document.forms[ "jg_input"].elements[ "meshstart" ].value); //;
	var mstop = parseFloat(document.forms[ "jg_input"].elements[ "meshend" ].value); //;
	var msize = parseFloat(document.forms[ "jg_input"].elements[ "meshsize" ].value); //;

	coord.scaleToCurve( pfn, mstart, mstop, msize );

	drawcurve( pfn, coord, mstart, mstop, msize );
}

function jgbezier ( drawarea ) {
	var bpoints = new Array();
	var bpointcnt = 0;
	unitsquare.dontscale = true;
	$( "#mousetarget" ).bind( "click", function (e) {
		if( bpointcnt < 4 ) {
			var rect = drawrectangle( "blackrectangle", e.pageY + 2, e.pageX - 2, 4, 4 );
			$( rect ).attr( "id", "bcctl_" + bpointcnt );
			bpoints[bpointcnt] = drawarea.screenCoordinatesToPoint( e.pageX, e.pageY );
			++bpointcnt;
			if( bpointcnt == 4 ) {
				// mark what is already here
				$( ".blackrectangle" ).addClass( "oldrectangle" );
				// attach mouse handlers
				$( "#mousetarget" ).remove();
				var drawing = false;
				$( ".blackrectangle" ).bind( "mousedown", function ( e ) {
					var movetarget = this;
					$( "body" ).bind( "mousemove", function ( e ) {
						$( movetarget ).css( "top", e.pageY + 2 );
						$( movetarget ).css( "left", e.pageX - 2 );
						var myid = $( movetarget ).attr( "id" );
						var myindex = parseInt( myid.substr( 6 ) );
						bpoints[ myindex ] = drawarea.screenCoordinatesToPoint( e.pageX, e.pageY );
						if( !drawing ) {
							drawing = true;
							drawbcurve();
							// mark the new points
							drawing = false;
						}
					} );
				});
				$( "body" ).bind( "mouseup", function ( e ) {
					$( "body" ).unbind( "mousemove" );
					drawbcurve();
				});
				//draw curve
				var drawbcurve = function () {
					// remove old curve
					$( ".newrectangle" ).remove();
					var xpath = genbezierequation( bpoints[0].x, bpoints[1].x - bpoints[0].x, bpoints[2].x, bpoints[2].x - bpoints[3].x );
					var ypath = genbezierequation( bpoints[0].y, bpoints[1].y - bpoints[0].y, bpoints[2].y, bpoints[2].y - bpoints[3].y );
					$( "#xformula" ).attr( "value", xpath );
					$( "#yformula" ).attr( "value", ypath );
					$( "#jgmeshstart" ).attr( "value", '0' );
					$( "#jgmeshend" ).attr( "value", '1' );
					$( "#start_calc" ).trigger( "click" );
					// mark the new points
					$( ".blackrectangle" ).addClass( "newrectangle" );
					$( ".oldrectangle" ).removeClass( "newrectangle" );
				}
				drawbcurve();
				// mark the new points
				$( ".blackrectangle" ).addClass( "newrectangle" );
				$( ".oldrectangle" ).removeClass( "newrectangle" );
			}
		}
	});
}
</script>
</head>
<body onLoad="javascript:loadinputdata()" >
<div class="jgdialog">
<form id="jg_input">
<table>
<tr><td>Y equation:</td><td><input id="yformula" name="yformula" value="x*x" /></td></tr>
<tr><td>X equation:</td><td><input id="xformula" name="xformula" value="x" /></td></tr>
<tr><td>Path start:</td><td><input id="jgmeshstart" name="meshstart" value="-1" /> </td></tr>
<tr><td>Path end:</td><td><input id="jgmeshend" name="meshend" value="1" /></td></tr>
<tr><td>Mesh size:</td><td><input name="meshsize" value="0.1" /></td></tr>
<tr><td><img id="start_bezier" src="jgbezier.jpg" onClick="javascript:jgbezier(unitsquare)" /></td><td><img id="start_calc" src="jggraph.jpg" onClick="javascript:jggraph(unitsquare)" /></td></tr>
</table>
</form>
<table>
<th>Allowed inputs</th>
<tr><td>x</td><td>the path variable</td></tr>
<tr><td>PI</td><td>half the cercomference of the unit circle</td></tr>
<tr><td>E</td><td>mysterious transcindental constant the keeps showing up</td></tr>
<tr><td>123.456</td><td>numerical constants</td></tr>
<tr><td>2 * ( x + 5 )</td><td>+, -, /, *, plus grouping</td></tr>
<tr><td>fn( expression )</td><td>where fn is one of: cos, sin, tan, acos, asin, atan, sqrt, exp, ln</td></tr>
<tr><td>D( expression )</td><td>take the path derivative of "expression"</td></tr>
<tr><td>S( expression )</td><td>take the path integral of "expression"</td></tr>
<tr><td>pow( expression1, expression2 )</td><td>expression1 is the base, expression2 is the exponent</td></tr>
</table>
</div>
<script type="text/javascript" >
drawrectangle( "whiterectangle", 0, 0, "100%", "100%" );  // make a background rectangle, not necessary with default browser settings
var unitsquare = new jgcoordinates();
yaxis1 = unitsquare.pointToScreenCoordinates( 1, unitsquare.y1 );
yaxis0 = unitsquare.pointToScreenCoordinates( 1, unitsquare.y0 );
//drawline( 1, yaxis0.x, yaxis0.y, yaxis1.x, yaxis1.y );
yaxis1 = unitsquare.pointToScreenCoordinates( -1, unitsquare.y1 );
yaxis0 = unitsquare.pointToScreenCoordinates( -1, unitsquare.y0 );
//drawline( 1, yaxis0.x, yaxis0.y, yaxis1.x, yaxis1.y );
</script>
<script type="text/javascript" >
$( document ).ready( function () {
	//alert( "hello jquery world!" );
	$( "#mousetarget" ).css( "top", unitsquare.screeny1 );
	$( "#mousetarget" ).css( "left", unitsquare.screenx0 );
	$( "#mousetarget" ).height( unitsquare.screeny0 - unitsquare.screeny1 );
	$( "#mousetarget" ).width( unitsquare.screenx1 - unitsquare.screenx0 );
});
</script>
<div id="mousetarget" class="mousetarget" >
</div>
</body>
</html>
futher reading
- .addClass() jQuery API
jQuery API documentation relevant to this hub - The finished javascript based graphing calculator - part 9 in a series
Just an example of how the javascript based graphing calculator may be used. Here is the finished javascript graphing calculator. If you have followed this series from the beginning, I have built up from some...