- HubPages»
- Technology»
- Computers & Software»
- Computer Software
Creating, Configuring and Using a Pivot Chart in Excel 2007 and Excel 2010
Why you should use pivot charts instead of normal charts in Excel 2007 and Excel 2010
Welcome to my hub on pivot charts. The Pivot chart allows you to create graphs or charts that are both versatile and extremely flexible.
- They are perfect for producing charts from dynamic data that changes frequently (such as daily sales totals) as well as
- For large data sets where you will be required to produce large numbers of chart or graphs quickly
- It is straightforward and easy to change an existing pivot chart to display different data
This flexibility and versatility of pivot charts will save you time you would otherwise spend recreating charts from scratch!
Pivot charts use a pivot table as the source of the data to be included in the chart. This is in turn linked to the original data source. So every time the original data is updated the chart is also automatically updated. You can use pivot tables to also perform statistical analysis on the data in the table using functions such as AVERAGE, SUM, MIN, and MAX etc). I have a hub that introduces the pivot table and covers creating and configuring them as well as how to use filters and sorting with them.
http://robbiecwilson.hubpages.com/hub/Creating-Pivot-Tables-in-Excel-2007
In today’s hub we will investigate how to:
- Create a pivot chart
- Refresh the data displayed in a pivot chart
- Changing the data displayed in your Pivot Chart
Creating a Pivot Chart in Excel 2007 and Excel 2010
When you create a pivot chart, Excel will automatically create a pivot table unless you opt to create a pivot chart from an existing one.
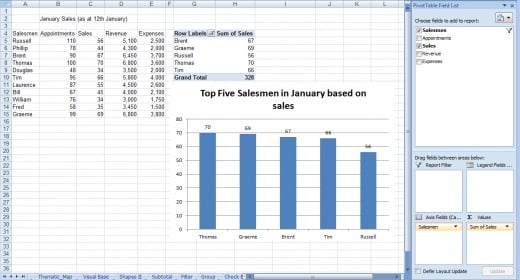
The process of creating the chart is identical in either case. We will create one, which will illustrate the top five salesmen (in terms of Sales), for January from raw data to show the entire process in case you are not familiar with pivot tables.
- The first step is to click anywhere in the data range you plan to chart
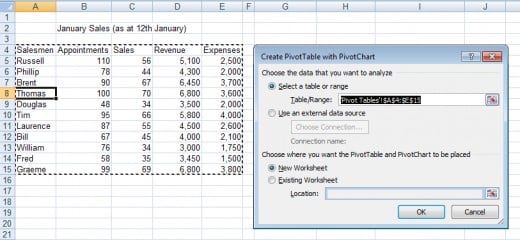
- Next, click on the PivotTable button and select Pivot Chart. The button can be found on the Insert tab within the Tables group
- Excel will automatically expand the selection to the entire data range. If this is not what you want, adjust the Table/Range in the Select a table or range section
- Now choose whether you want to place the chart in a New Worksheet, or select a Location in the Existing Worksheet
The PivotChart Filter Pane will now open.
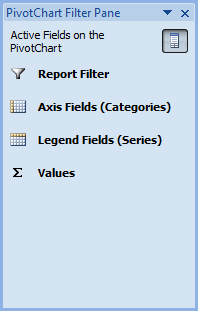
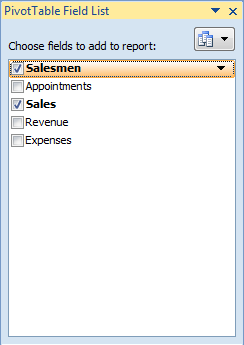
- You can safely close it (if you leave it open, it simply displays the selections you make in the pivot table) and you will see the PivotTable Field list open.
- We are interested in Salesmen and Sales, so we tick both of those
- To narrow this down to the top five salesmen, we now click on Salesmen and select the drop down arrow
- Now select Value Filters and then Top 10 and adjust it to just show the top 5
- The final thing we need to do is to sort the top five from highest to lowest on the chart. To do this, we go back to the drop down list for Salesmen as we did above, although this time we select More Sort Options
- Click Descending (Z to A) by and choose Sum of Sales, then click OK
The chart is almost complete. You can also see from the figure below that Excel also creates a pivot table.
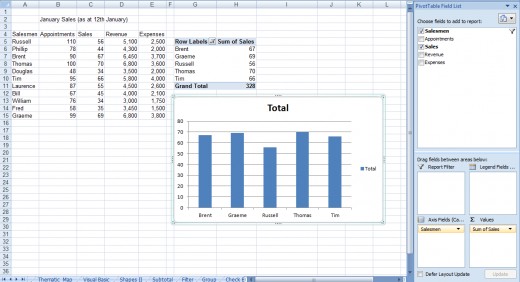
Now all we need to do is to clean up the chart and it is complete. If you would like to learn more about creating and configuring charts and graphs, I have a hub that covers this in great detail which can be found here:
http://robbiecwilson.hubpages.com/hub/Creating-charts-and-graphs-in-Excel-2007
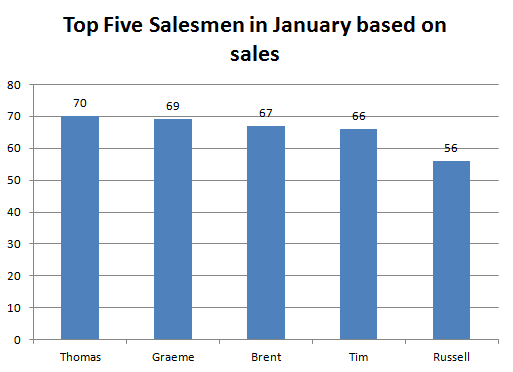
Changing the data displayed in your Pivot Chart using Excel 2007 and Excel 2010
The real power of the pivot chart lies in how easy it is to change the data that your chart displays. Imagine if my manager calls me and says that she needs a chart showing the bottom five salesmen in terms of expenses (highest equals worst in this case, I can easily do that:
- First, I select the chart
- Second, I clear the tick next to Sales and select Expenses
- Finally, I repeat the filters and sorting I used above to sort them biggest to smallest and filter them by the top five
- So in no time at all, we have the chart that my manager asked for!
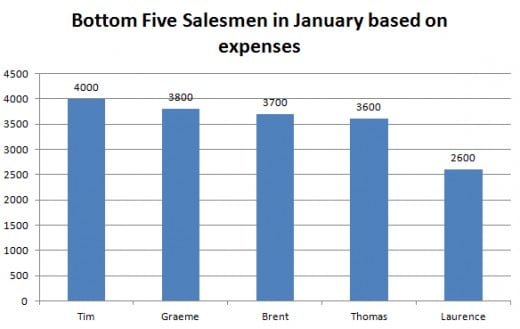
Note: The existing formatting within your chart (Chart title as well as any other changes to the appearance of your chart or graph) will remain the same when you change the data displayed. However, any filters you apply to the data (for example, displaying the top five items) will be reset and have to be re-applied when you change the data you wish to display.
Refreshing the data in your Pivot Chart in Excel 2007 and Excel 2010
Along with being able to change the data displayed in your pivot chart quickly and easily, the second major advantage of pivot charts is how easily they work with dynamic or frequently changing data.
In our example, we have been working with monthly sales data from our team of salesmen. Every day, they enter in their sales for the day and every day we create a new chart. When using normal charts, you would have to recreate it. However, with a pivot chart, you just have to refresh the chart. You can see below that the sales data for the 13th is now in.
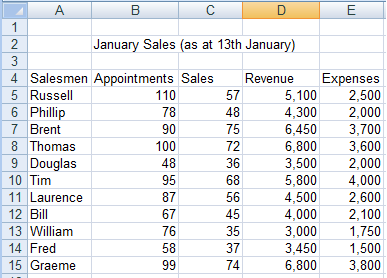
To refresh the data in your pivot chart:
- Right click anywhere on your pivot table or pivot chart and select Refresh Data
This pulls the latest data from your data source for your pivot table and refreshes both the pivot table and the pivot chart automatically.
Conclusion
Pivot charts are as flexible and versatile as pivot tables. They allow you to:
- Easily create multiple charts simply and quickly from a large data source.
- They work particularly well with dynamic data as we saw in the example above
- You can also change what the chart displays very easily and quickly utilising the same formatting as the previous chart
I do hope you enjoyed reading my introduction to pivot charts as much as I enjoyed writing it.
I also have a number of other hubs on aspects of Excel, covering everything from Conditional Formatting to sharing and protecting documents. These can be accessed via my index hub on Excel below.
The hub also covers how I successfully transitioned from the traditional menus in Excel 2003 to the ribbon that is used in Excel 2007 and Excel 2010 as well as outlining my other Excel 2007 / 2010 hubs which can be found here
Many thanks for reading, please feel free to leave any comments you may have below.

