- HubPages»
- Technology»
- Computers & Software»
- Computer Science & Programming»
- Programming Languages
Graphing functions in Javascript - part 5 in a series
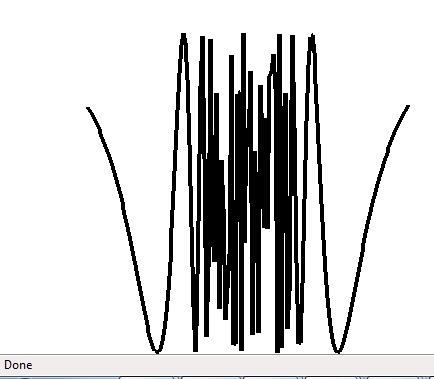
graph of cos( 1/x^2)
discussion about graphing functions in Javascript
In the previous hub in this series, I wrote Javascript code to draw a circle on the screen. This hub will take a small additional step in preparation for something bigger.
Paths can also be used to graph 2-d functions. You just need to construct a path function which returns (x, f(x)). I have I have done this for cos(1/x^2) here. It is famous for having a singularity at the origin. I avoided the singularity by constructing a mesh of points to graph that does not include x=0. So, you can see what the function looks like. However, near the origin, the mesh is not fine enough to capture all of the oscilations this function makes. You could try reducing the mesh size to see how much detail you can get before Javascript runs out of resources and freezes your browser. The last will be a little inconvenient, but what is a little inconvenience in the name of adventure?
code for rendering cos( 1/x^2)
<html>
<head>
<style type="text/css" >
.whiterectangle { color: white; background-color: white; z-index: 0;}
.blackrectangle { color: black; background-color: black; z-index: 1;}
</style>
<script type="text/javascript" >

var jgpointbase = {
	x: 0,
	y: 0
};

function jgpoint( ) {
	this.prototype = jgpointbase;
	//this.x = x;
	//this.y = y;
};

function jgptsc( x, y ) {
		var rval = new jgpoint( );
		rval.x =  this.screenx0 + (( this.screenx1 - this.screenx0 ) / ( this.x1 - this.x0 )) * ( x - this.x0 );
		rval.y =  this.screeny0 + (( this.screeny1 - this.screeny0 ) / ( this.y1 - this.y0 )) * ( y - this.y0 );
		return( rval );
}

var jgcoordinatesbase = {
	x0: -1.25,
	screenx0: 50,
	y0: -1.25,
	screeny0: 450,
	x1: 1.25,
	screenx1: 450,
	y1: 1.25,
	screeny1: 50,
	pointToScreenCoordinates: jgptsc
};

function jgcoordinates() {
}

jgcoordinates.prototype = jgcoordinatesbase;


function drawrectangle( myclass, top, left, width, height )
{
	var bodylist = document.getElementsByTagName( "body" );
	var rect = document.createElement( "div" );
	var mystyle = 'position:absolute;top:' + top + ";left:" + left + ';width:' + width + ";height:" + height;
	rect.setAttribute( "class", myclass );
	rect.setAttribute( "style", mystyle );
	bodylist[0].appendChild( rect );
}

function drawline( width, x1, y1, x2, y2 )
{
	var x, y, nexty, nextx;
	x1 = Math.round( x1 );
	y1 = Math.round( y1 );
	x2 = Math.round( x2 );
	y2 = Math.round( y2 );
	// ensure x1, y1 is leftmost point
	if( x1 > x2 ) {
		tmp = x2;
		x2 = x1;
		x1 = tmp;
		tmp = y2;
		y2 = y1;
		y1 = tmp;
	}
	var dx = x2 - x1;
	var dy = y2 - y1;

	if( dy == 0 ) { // horizontal line
		drawrectangle( "blackrectangle", y1 - width / 2, x1, dx, width );
		return;
	} else if ( dx == 0 ) { // vertical line
		drawrectangle( "blackrectangle", y1, x1 - width / 2, width, dy );
		return;
	}
	var slope = dy / dx;
	if( slope > 1 || slope < -1 ) {
		// one x per multiple y
		if( y1 < y2 ) {
			y = y1;
			for( x = x1 ; x < x2 ; x += 1 ) {
				nexty = y + slope;
				drawrectangle( "blackrectangle", y, x - width / 2, width, nexty - y );
				y = nexty;
			}
		} else {
			y = y1;
			for( x = x1 ; x < x2 ; x += 1 ) {
				nexty = y + slope;
				drawrectangle( "blackrectangle", nexty, x - width / 2, width, y - nexty );
				y = nexty;
			}
		}

	} else {
		// one y per multiple x
		if( y1 < y2 ){
			x = x1;
			for( y = y1 ; y < y2 ; y += 1 ) {
				nextx = x + 1 / slope;
				drawrectangle( "blackrectangle", y - width / 2, x, nextx - x, width );
				x = nextx;
			}
		} else {
			x = x2;
			for( y = y2 ; y < y1 ; y += 1 ) {
				nextx = x + 1 / slope;
				drawrectangle( "blackrectangle", y - width / 2, nextx, x - nextx, width );
				x = nextx;
			}
		}
	}


}

function jgcircle( angle ) {
	var rval = new jgpoint();

	rval.x = Math.cos( angle );
	rval.y = Math.sin( angle );
	return( rval );
}

function jgcos1overx2( x ) {
	var rval = new jgpoint();

	rval.x = x;
	rval.y = Math.cos( 1 / ( x * x ) );
	return rval;
}

function drawcurve( curvefn, coord, fnstart, fnstop, delta ) {
	var pt;
	var fofpt;
	var screenpt, newscreenpt;

	fofpt = curvefn( fnstart );
	screenpt = coord.pointToScreenCoordinates( fofpt.x, fofpt.y );
	for( pt = fnstart + delta ; pt <= fnstop + delta ; pt += delta ) {
		fofpt = curvefn( pt );
		newscreenpt = coord.pointToScreenCoordinates( fofpt.x, fofpt.y );
		if( screenpt.x != newscreenpt.x || screenpt.y != newscreenpt.y ) {
			drawline( 4, screenpt.x, screenpt.y, newscreenpt.x, newscreenpt.y );
			screenpt = newscreenpt;
		}
	}
}
</script>
</head>
<body>
<script type="text/javascript" >
drawrectangle( "whiterectangle", 0, 0, "100%", "100%" );  // make a background rectangle, not necessary with default browser settings
var unitsquare = new jgcoordinates();
startpoint = unitsquare.pointToScreenCoordinates( -1, -1 );
endpoint = unitsquare.pointToScreenCoordinates( 1, 1 );
drawcurve( jgcos1overx2, unitsquare, -1, 1, 0.012 );
</script>
</body>
</html>
Links to previous hubs in this series
- Drawing Circles in Javascript - part 4 in a series
A slightly irregular, but very recognizable circle There is a certain amusing irony to making javascript draw in circles. There also interesting points to be made about drawing circles both in regard to...
