ArtsAutosBooksBusinessEducationEntertainmentFamilyFashionFoodGamesGenderHealthHolidaysHomeHubPagesPersonal FinancePetsPoliticsReligionSportsTechnologyTravel

How Not to Screw Up Your Models

Updated on September 5, 2019
tamarawilhite profile image

Tamara Wilhite is a technical writer, an industrial engineer, a mother of two, and a published sci-fi and horror author.

Introduction

When you are creating models to simulate a process or product, what can you do to not screw up the models? How can you improve the accuracy of simulations and reduce the odds that your data models are completely at odds with reality?
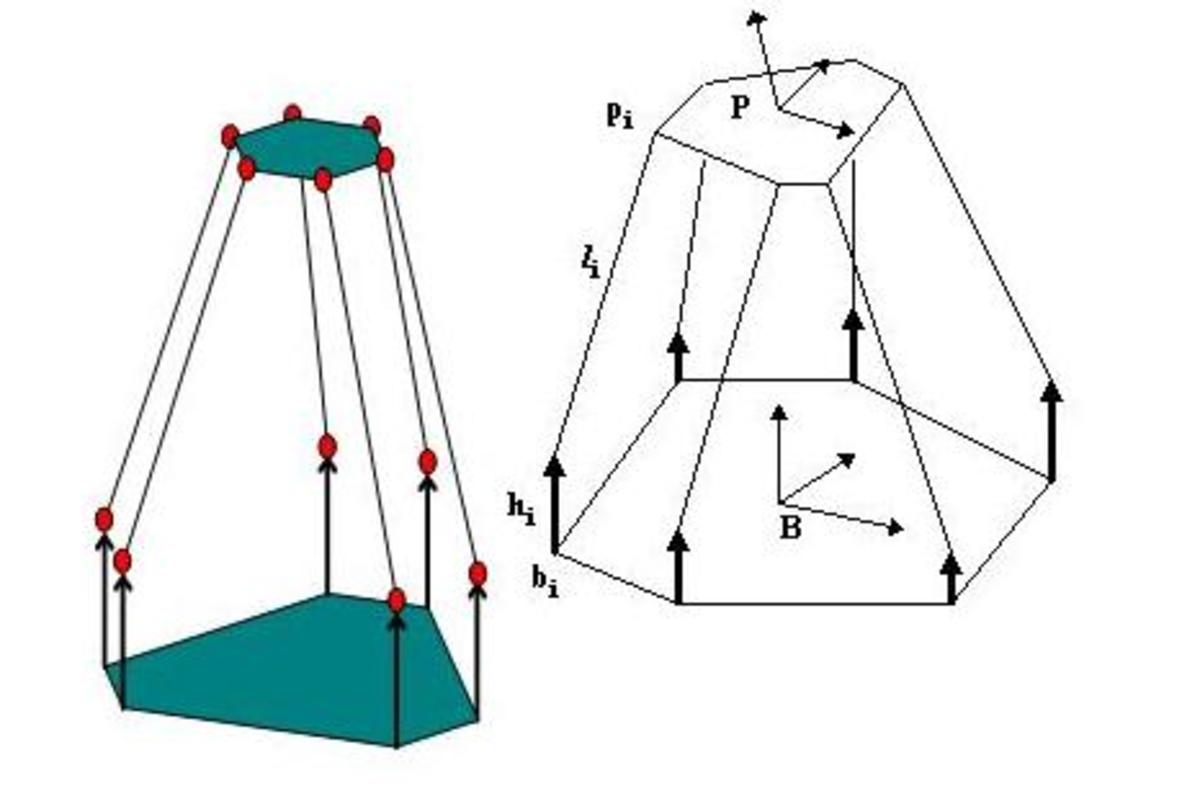
Computer models are at best a good guess, a pretty picture with incorrect conclusions at worst.
Computer models are at best a good guess, a pretty picture with incorrect conclusions at worst. | Source

How Not to Mess Up Your Computer Models

Think about the variables that affect the process, such as heat or material quality, not just the process variables like cycle time and human schedules. A model based on a temperature stable environment with heat sensitive materials will be inaccurate when your model doesn’t reflect the actual effects of a hot warehouse and production line.
Compare your model to real world data after the model's been run over time, as you collect real world data as time goes by. Most importantly, if the model doesn't match reality, adjust the model, not the data.
Avoid the temptation to adjust the historical data sets to fit the model, such as throwing out too many outliers or “adjusting” the historic data. Periodic outliers indicate something you aren’t accounting for or provide proof that the process isn’t as neat as your simulation supposes.
The more your data is “treated” or based on estimations and approximations, the more error your model has. For example, temperature data estimated from tree rings and fossil records are not nearly as accurate as temperature from weather stations, no matter how much you want it to be.
Don't get emotionally invested in a model; it is, at best, an approximation of reality.
Running a model off of historic data on which its equations was built doesn’t count as verification except to the degree that if 2+2=4 and 4-2=3.5, you know the model is wrong.
Remember that data trends can often be modeled using different distributions – try different probability distribution types before throwing out the model.
There are always variables you don’t know about.
You can never build a model with all the variables. The complexity of trying to model everything adds more error and uncertainty than a model with the main variables and an understanding that it is 90% to 95% there.
Correlation is not causation.
A really good R-squared doesn’t mean it is correlated, either. One of my professors, Dr. Imrahn, had an excellent presentation linking traffic in California with the population growth of India at the same time. Greater than 95% correlation, but the two trends are obviously unrelated. The website Spurious Correlations by Tyler Vigen has even tightly correlated, unrelated examples.
Recognize that extrapolation is an estimation, when your variable is modeled off data from a small experimental range.
Modeling non-linear systems as linear may be easier and even close to reality, but this may alter other variables so much that the model is useless.

To quote Dr. Pape in my UTA IE program, we have yet to devise a way to soak up variability. Add more variables and you get more uncertainty. Don't assume that adding yet another variable makes the answer more accurate; you just might be more uncertainty in the answer and thus real world data falls within the now wider margin of error.
To borrow from an XKCD joke, physicists like to say you can model anything off some simple process and add another equation to cover the complexities. If your basic model is wrong for the situation, the entire model is wrong.
Recognize that the average result of your models run a thousand times is simply an average of all your educated guesses, and if your assumptions are wrong or the data cherry picked, no more correct than a random guess.
Even data from formal measurements can be off, such as the weather stations that showed significant global warming found to be now surrounded by urban heat islands demonstrated, in contrast to the stable temperatures that still rural weather stations showed.

To quote Kip Hansen, “Nearly all real-world dynamical systems are nonlinear, exceptions are vanishingly rare.” Assuming linear trends makes it easy to project an answer, but that doesn’t make it right when the system is non-linear.

working

This website uses cookies

As a user in the EEA, your approval is needed on a few things. To provide a better website experience, hubpages.com uses cookies (and other similar technologies) and may collect, process, and share personal data. Please choose which areas of our service you consent to our doing so.

For more information on managing or withdrawing consents and how we handle data, visit our Privacy Policy at: https://corp.maven.io/privacy-policy

Show Details
Necessary
HubPages Device IDThis is used to identify particular browsers or devices when the access the service, and is used for security reasons.
LoginThis is necessary to sign in to the HubPages Service.
Google RecaptchaThis is used to prevent bots and spam. (Privacy Policy)
AkismetThis is used to detect comment spam. (Privacy Policy)
HubPages Google AnalyticsThis is used to provide data on traffic to our website, all personally identifyable data is anonymized. (Privacy Policy)
HubPages Traffic PixelThis is used to collect data on traffic to articles and other pages on our site. Unless you are signed in to a HubPages account, all personally identifiable information is anonymized.
Amazon Web ServicesThis is a cloud services platform that we used to host our service. (Privacy Policy)
CloudflareThis is a cloud CDN service that we use to efficiently deliver files required for our service to operate such as javascript, cascading style sheets, images, and videos. (Privacy Policy)
Google Hosted LibrariesJavascript software libraries such as jQuery are loaded at endpoints on the googleapis.com or gstatic.com domains, for performance and efficiency reasons. (Privacy Policy)
Features
Google Custom SearchThis is feature allows you to search the site. (Privacy Policy)
Google MapsSome articles have Google Maps embedded in them. (Privacy Policy)
Google ChartsThis is used to display charts and graphs on articles and the author center. (Privacy Policy)
Google AdSense Host APIThis service allows you to sign up for or associate a Google AdSense account with HubPages, so that you can earn money from ads on your articles. No data is shared unless you engage with this feature. (Privacy Policy)
Google YouTubeSome articles have YouTube videos embedded in them. (Privacy Policy)
VimeoSome articles have Vimeo videos embedded in them. (Privacy Policy)
PaypalThis is used for a registered author who enrolls in the HubPages Earnings program and requests to be paid via PayPal. No data is shared with Paypal unless you engage with this feature. (Privacy Policy)
Facebook LoginYou can use this to streamline signing up for, or signing in to your Hubpages account. No data is shared with Facebook unless you engage with this feature. (Privacy Policy)
MavenThis supports the Maven widget and search functionality. (Privacy Policy)
Marketing
Google AdSenseThis is an ad network. (Privacy Policy)
Google DoubleClickGoogle provides ad serving technology and runs an ad network. (Privacy Policy)
Index ExchangeThis is an ad network. (Privacy Policy)
SovrnThis is an ad network. (Privacy Policy)
Facebook AdsThis is an ad network. (Privacy Policy)
Amazon Unified Ad MarketplaceThis is an ad network. (Privacy Policy)
AppNexusThis is an ad network. (Privacy Policy)
OpenxThis is an ad network. (Privacy Policy)
Rubicon ProjectThis is an ad network. (Privacy Policy)
TripleLiftThis is an ad network. (Privacy Policy)
Say MediaWe partner with Say Media to deliver ad campaigns on our sites. (Privacy Policy)
Remarketing PixelsWe may use remarketing pixels from advertising networks such as Google AdWords, Bing Ads, and Facebook in order to advertise the HubPages Service to people that have visited our sites.
Conversion Tracking PixelsWe may use conversion tracking pixels from advertising networks such as Google AdWords, Bing Ads, and Facebook in order to identify when an advertisement has successfully resulted in the desired action, such as signing up for the HubPages Service or publishing an article on the HubPages Service.
Statistics
Author Google AnalyticsThis is used to provide traffic data and reports to the authors of articles on the HubPages Service. (Privacy Policy)
ComscoreComScore is a media measurement and analytics company providing marketing data and analytics to enterprises, media and advertising agencies, and publishers. Non-consent will result in ComScore only processing obfuscated personal data. (Privacy Policy)
Amazon Tracking PixelSome articles display amazon products as part of the Amazon Affiliate program, this pixel provides traffic statistics for those products (Privacy Policy)
ClickscoThis is a data management platform studying reader behavior (Privacy Policy)