- HubPages»
- Technology»
- Computers & Software»
- Computer Software
Guide to using the Subtotal button in Excel 2007 and Excel 2010 to group and summarise data
How to use the Subtotal button in Excel 2007 and Excel 2010 to quickly and easily add sub totals and grand totals
Hi, and welcome to my latest hub on Excel 2007 and Excel 2010. This hub will introduce to you the very useful Subtotal button. Alongside the ability to create sub totals, this button allows you to also:
- Group your data into meaningful groups automatically
- Collapse your data, hiding detail to display it in a summarised table format
- Add sub totals and a grand total to your data using a variety of mathematical functions (sum, average, count etc)
- Easily change your subtotals by selecting your data, clicking the Subtotal button once more and choosing different options
This will allow you to easily produce useful summaries of your data based on your requirements as well as collapsing your data into logical groups to make it easier for people to read.
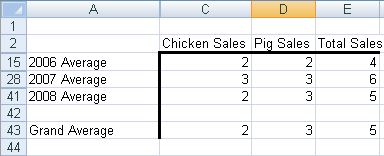
In the figures below, you can see the raw data and the table created from that data using the Subtotal button.
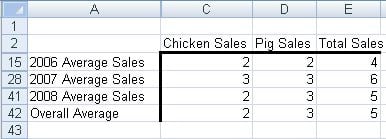
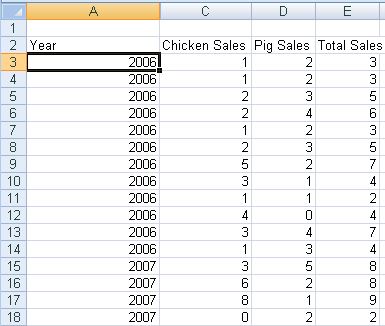
The ability to group data as illustrated by using the Subtotal button is very powerful. For example, I used it to collapse a software inventory containing hundreds of pieces of software, installed on hundreds of PCs, including all the different versions, to allow people to browse the parts of the inventory they were concerned with.
The Group and ungroup buttons are explored in far greater detail in my hub on the subject. The Group button allows you to collapse enormous amounts of data down to just a few lines. User of your data can then expand the parts they are interested in to analyse it further, ignoring the sections of the data they are not interested in. This can be found by clicking the following link.
http://robbiecwilson.hubpages.com/hub/Filtering-and-Grouping-data-in-Excel-2007
How to configure the data in your Excel 2007 or Excel 2010 spreadsheet to get the best results from the Subtotal button
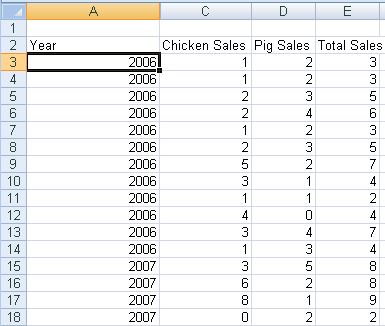
Configuring your data to work best with sub totals is quite straightforward, provided you follow a couple of simple rules. If we look at my data below for my fictitious chicken and pig farm, I have data from the sales of chickens and pigs for the years 2006, 2007 and 2008.
The first rule of Subtotals is: Columns must have labels!
Excel expects columns to have labels and will give you an error if these are not present. You can click OK on the error should you not have column labels and Excel will take the first row as labels rather than as data which is unlikely to be what you want so it is best to click Cancel and add the labels first.
The second rule of Subtotals is: Excel will not ignore empty cells!
Unlike many functions and buttons in Excel, if you select empty rows below your data, Excel will add those into your subtotalled results. It will not change the calculations, but will make your summary table look a little odd. You can see this in the figure below. I selected a blank row at when selecting my data and Excel has added it into the summary table.
How to create Sub Totals and Grand Totals from your data using the Subtotal button in Excel 2007 and Excel 2010
So, as a successful chicken and pig farmer, at the end of 2008 I want to be able to summarise my sales data easily into:
- Overall total sales
- Total sales for both chickens and pigs
- Annual sales for both animals as well as an annual grand total
The Subtotal button in Excel will allow me to do this quickly and easily. Having followed the two rules of subtotals, my data is configured correctly and I am ready to start.
- First, click on a cell within the data range you want to subtotal and then click the Data tab, then the Subtotal button
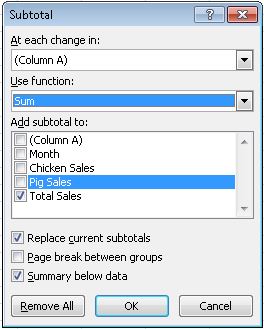
- Excel will open up the dialogue box for Subtotals (as you can see to the right)
Let’s go through each of the options Excel gives you to fully understand what you can configure and what those changes will give you.
- The top option is At each change in: this defaults to the first column in your data. In my case, this data is years. So each change in year, Excel will create a subtotal. This is what I want, so I leave it as it is.
- The second option is Use Function: which tells Excel which function to use to create the subtotals. The default is SUM. I would like to use AVERAGE, so I select that instead.
- The third option to choose is Add subtotal to: allowing you to decide what Excel will create subtotals for. Choose everything that you would like to be sub totalled.
In my case, I want a subtotal for each change in Year. I want to sum the data for each year. I want a subtotal for Chicken Sales, Pig Sales and Total Sales. I configure the dialogue box as below and click OK.
The final three options, I would leave as default. The final option puts the grand total at the bottom, clear that option should you want it to appear at the top.
Once you have completed your selections and pressed OK, you will see something similar to mine below:
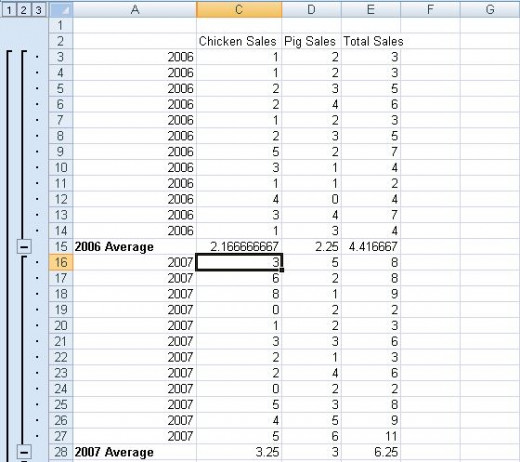
On the left hand side of your worksheet you will see that the numbers 1, 2 and 3 have been added with groups also being created.
- Clicking 1 will show the Grand Total for all my grouped data.
- If I click 2 it will show the annual totals for the years 2006, 2007 and 2008 for Chicken Sales, Pig Sales and Total Sales.
- Selecting 3 will show the data completely expanded.
Adding, removing or changing Subtotals in Excel 2007 and Excel 2010
Should you decide that you either wish to add additional subtotals or remove the subtotals, or even change the function you are concerned with (for example, I may decide that I want to average my sales rather than having a total) this is done by simply clicking the Subtotal button (ensure you select a cell within the data range first).
To change the subtotals, simply choose a different function in the Use Function drop down box. To change the data you want to subtotal, select or deselect it as desired in the Add subtotal to section. Ensure that the Replace current subtotals option is selected to avoid duplication of subtotals (unless that is what you wanted of course).
To add extra subtotals (you could for example show the average and the overall total on subsequent rows), simply change the function to whatever you want to show in addition to what you already have and clear the Replace current subtotals option before clicking OK.
To remove the subtotals and the groups themselves, click a cell in the data range the Subtotal button and select Remove All. This will remove all your groups and subtotals and return your data to the way it was originally.
Conclusion
The Subtotal button in Excel 2007 and Excel 2010 is a powerful and versatile button that:
- Allows you to group and summarise your data easily and quickly
- Subtotals your data
- Enables you to use a variety of mathematical function such as average and sum to summarise your data
- Provides Grand totals for your data
- Can collapse a very large data set into a small and very easy to read table
- Are able to be changed or even removed with the click of one button
I hope that you have enjoyed reading my hub and have found it useful and informative. Please feel free to leave a comment below.

