- HubPages»
- Technology»
- Computers & Software»
- Computer Science & Programming»
- Programming Languages
animating bezier curves with html 5 canvas tag and jquery

some graphs using canvas
canvas versus SVG versus HTML4 and CSS
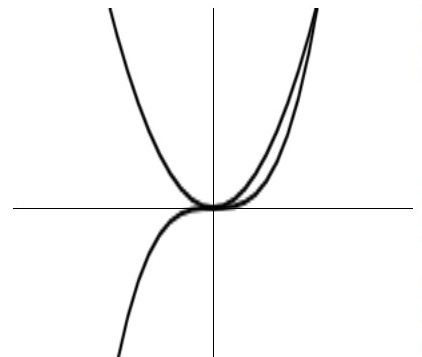
I have been writing a series of hubs on using javascript to draw graphs and annimate the design of Bezier curves. This Hub uses the third and last available mechanism for rendering paths on an HTML page, the canvas tag. I have already covered using CSS styles with div tags, and inline SVG in previous hubs.
Once again, it seems the hard part is meshing up the coordinate system of the canvas tag with my coordinate system. By trial and error, I found that adding the following couple of transforms aligned my canvas generated graphs with where they were supposed to be on the page
ctx.translate( left/2, -top );
ctx.scale( .5, .5 );
I am not sure why the initial tranform should be something other than an identity mapping. I think I should just have to translate the upper left corner of the canvas to the upper left corner of the canvas tag on the page, but that is not my experience. There is also, an as yet unresolved, offset between the Bezier Curve control points and where the curve is rendered. While these mysteries demostrate some remaining gaps in my knowledge of canvas, I have enough of my code working to make a useful comparison of canvas with inline SVG.
A canvas is represented as a single tag within HTML. All of the drawing operations are methods of context object that can be derrived from the canvas tag's DOM element. Unlike, SVG drawing elements, such as circles, paths, rectangles, are not represented within the DOM structure. However, since in my manipulation of SVG, I only opperated on the encapsulating SVG tags, it is straight-forward to map my approach with SVG to canvas operations.
I need to give each canvas tag a unique id, so that I can modify it from javascript after it is inserted into the DOM. Otherwise, I just substitute calls moveTo and lineTo methods for points that were stored in the SVG path tag attributes. With no other changes to my code, it works as before (except for the coordinate mapping thing). The modified drawcurve function is below.
Evidently, canvas has been around a bit longer than inline SVG. Apple introduced it into Safari, then other browsers adopted it. Now, it has been acknowledged as a part of the HTML 5 standard. This would be a reason for using canvas rather than SVG; more of your users are likely to already be using a browser that supports it. There may be some performance advantages of canvas. I have heard this, and it seems like the animation of Bezier Curves was pretty responsive.
Conversely, even though it turns out I didn't use any of them, It seems to me there are advantages to exposing drawing elements within the DOM. You could modify part of an drawing after the fact. Drawing elements could be mixed with other page elements more naturally. Also, being able to see the numerical representation of my paths, did help with my debugging. Canvas smells to me a bit of the old "revise and extend" kind of standard that Microsoft used to frequently promolgate. SVG feels more completely in line with the spirit of the document object model. In a couple years the ubiquity of browser support will be the same.
the drawcurve function redone to use a canvas tag
var globalcid = 1;

function drawcurve( curvefn, coord, fnstart, fnstop, delta ) {
	var pt;
	var fofpt;
	var screenpt, newscreenpt;
	var top;
	var left;
	var width;
	var height;
	var canvasid = "canvas" + globalcid++;

	if( coord.screenx0 < coord.screenx1 ) {
		left = coord.screenx0;
		width = coord.screenx1 - coord.screenx0;
	} else {
		left = coord.screenx1;
		width = coord.screenx0 - coord.screenx1;
	}
	if( coord.screeny0 < coord.screeny1 ) {
		top = coord.screeny0;
		height = coord.screeny1 - coord.screeny0;
	} else {
		top = coord.screeny1;
		height = coord.screeny0 - coord.screeny1;
	}

	var path="<canvas id='" +canvasid+"' class='newrectangle' style='position:absolute;" +
		"height:" + height + "px; width:" + width + "px; top:" + top + "px; left:" + left +
		"px;'  >" +
  		"</canvas>";

	$( path ).appendTo( "body" );

	var canvas = document.getElementById( canvasid );
	var ctx = canvas.getContext( "2d" );
	var op = "M ";
	ctx.lineWidth = 4;
	ctx.strokeStyle = "black";
	ctx.translate( left/2, -top );
	ctx.scale( .5, .5 );
	ctx.beginPath();

	fofpt = curvefn( fnstart );
	screenpt = coord.pointToScreenCoordinates( fofpt.x, fofpt.y );
	for( pt = fnstart + delta ; pt < fnstop ; pt += delta ) {
		fofpt = curvefn( pt );
		newscreenpt = coord.pointToScreenCoordinates( fofpt.x, fofpt.y );
		if( screenpt.x != newscreenpt.x || screenpt.y != newscreenpt.y ) {
			if( op == "M " ) {
				ctx.moveTo( screenpt.x, screenpt.y);
				op = " L ";
			}
			ctx.lineTo( newscreenpt.x, newscreenpt.y);
			screenpt = newscreenpt;
		}
	}
	ctx.stroke();
	ctx.save();
}
further reading
- Dive Into HTML5: Using Canvas Element In The Real World
So what is HTML5? Before we began exploring HTML5 canvas element in more detail, let’s take a moment to discuss what HTML5 actually is. Using a strict definition, it’s an evolution of previous HTML4 specifications in the DOM Level 2...