- HubPages»
- Technology»
- Computers & Software»
- Computer Science & Programming»
- Programming Languages
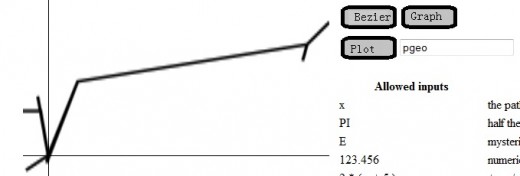
charting personal geographies - AJAX and the graphing calculator - part 3 in a series

My personal geography for the last couple weeks

The event handler for fetching data from the Web server
var xpts = new Array();
var ypts = new Array();
var yi = 0;
var xi = 0;

function getPath( url, coord ){

	if( url == "" ) {
		url = "/" + $( "#datafile" ).val() + ".xml";
	}
	$.get( url,
		"",
		function ( data ) {
			$( data ).find( "point" ).each( function () {
				$(this).find( "x" ).each( function () {
					xpts[xi++] = $( this ).text();
				});
				$(this).find( "y" ).each( function () {
					ypts[yi++] = $( this ).text();
				});
			});
			jgplot( coord, xpts, ypts );
	});
}
The HTML code to allow the user to call the event handler
<tr><td><img id="start_plot" src="jgplot.jpg"
onClick="javascript:getPath('', unitsquare);"
 /></td><td><input id="datafile" name="datafile" value="path1" ></td></tr>
Fetching named data sets
In my previous Hub in this series, I covered the mechanics of obtaining input in Javascript: data format, making an HTTP request back to the server the page came from, and updating the DOM of the page that the user is viewing. In this Hub, I will let the user name the data set that they want to retrieve.
The code changes to fetch a named set of data from my Web server are not much. I just add an input tag for the user to enter the name of the data set into, and a few lines of code in jgGetPath to use the user supplied name. The javascript and HTML for doing this are on the left of the page.
The more difficult thing is to motivate what these data sets might be. For that, I will draw on a concept that I encountered in a college geography class; personal geographies. The path a person takes in their daily activities determines a lot about who they will meet and their impressions of the world around them. For example, most of our activities occur in built up areas. So, our impression of the world is that it is more made of man made things than it actually is.
Anyway, back to the problem at hand, I want to chart the locations various people visit during the course of a couple weeks. I will name the person, and the Web server will fetch the data describing where they have been, and my javascript code will chart that data. Furthermore, I want to merge the charts of different people in order to see how their daily routines relate.
For this example, I will just create a daily journal for each person under study and enter their data into a file manually. The name of the data set will just be the file name, minus path and extension. It would be a more interesting application, if the data came from cell phone records and the input name caused a server side script to extract and convert the cell phone records for the person named, but the phone company hasn't made their data available to me.
In order to merge personal geography plots for myself and others, I need to accumulate all of the data points into a single set of arrays. This is why xpts, ypts, xi and yi are global variables. I enter one plot, then add another to it. At that point, getPath, erases any plot that is already rendered by calling the jQuery functions $( ".newrectangle" ).remove and $( ".blackrectangle" ).remove() . The user can reset the accumulated plot by reloading the page.
I can imagine many ways to embellish this application. I could overlay the plot on a map, or color the lines for different people differently, for example. However, I will keep it simple. There are a couple of bugs I had to fix in my previous code, or features I had to add, depending on your point of view, in order to accommodate this new application.
I also had to generalize the scaleToCurve method of jgCoordinates to scale the x-axis, as well as, the y-axis, because when plotting a path, both the x and y values can change arbitrarily at any point. This is different from plotting functions where x moves smoothly between a start point and a finish point.
Finally, I had to force makeplotfn to return integers rather than whatever data the arrays xpts and ypts happened to contain. Otherwise, scaleToCurve would compare the returned values as strings, with unpredictable results.
So far, my data all resides in hand edited files that are stored on my Web server. In future Hubs, I will explore mechanisms for automating the generation of data for Ajax to fetch. The small, but important advance in this Hub is to allow the user to enter a string that describes the data they want to process. The data set and the plotting application are no longer hard coded together.
generalizing the scaleToCurve function
	scaleToCurve: function ( curvefn, fnstart, fnstop, delta ) {
		var pt;
		var fofpt;

		if( this.dontscale ) {
			return;
		}
		// get maximum and minimum x and y values
		fofpt = curvefn( fnstart );
		var minx = fofpt.x;
		var miny = fofpt.y;
		var maxx = fofpt.x;
		var maxy = fofpt.y;
		for( pt = fnstart + delta ; pt < fnstop; pt += delta ) {
			fofpt = curvefn( pt );
			if( fofpt.y > maxy ) {
				maxy = fofpt.y;
			}
			if( fofpt.y < miny ) {
				miny = fofpt.y;
			}
			if( fofpt.x > maxx ) {
				maxx = fofpt.x;
			}
			if( fofpt.x < minx ) {
				minx = fofpt.x;
			}
		}
		var aspectratio = ( this.y1 - this.y0 ) / ( this.x1 - this.x0 );
		if( this.y0 < miny ) {
			miny = this.y0;
		}
		if( this.y1 > maxy ) {
			maxy = this.y1;
		}
		if( this.x0 < minx ) {
			minx = this.x0;
		}
		if( this.x1 > maxx ) {
			maxx = this.x1;
		}
		var newaspectratio = ( maxy - miny ) / (maxx - minx );
		if( newaspectratio > aspectratio ) {
			// match y values and scale x values
			this.y0 = miny;
			this.y1 = maxy;
			var xlength = 1 / aspectratio * ( maxy - miny );
			this.x0 = minx + (maxx - minx) / 2 - xlength / 2;
			this.x1 = minx + (maxx - minx) / 2 + xlength / 2;
		} else {
			// match x values and scale y values
			this.x0 = minx;
			this.x1 = maxx;
			var ylength = aspectratio * ( maxx - minx );
			this.y0 = miny + (maxy - miny) / 2 - ylength / 2;
			this.y1 = miny + (maxy - miny) / 2 + ylength / 2;
		}
		if ( this.x0 < 0 && this.x1 > 0 ) {
			var yaxis1 = this.pointToScreenCoordinates( 0, this.y1 );
			var yaxis0 = this.pointToScreenCoordinates( 0, this.y0 );
			drawline( 1, yaxis0.x, yaxis0.y, yaxis1.x, yaxis1.y );
		}
		if( this.y0 < 0 && this.y1 > 0 ) {
			var xaxis1 = this.pointToScreenCoordinates( this.x1, 0 );
			var xaxis0 = this.pointToScreenCoordinates( this.x0, 0 );
			drawline( 1, xaxis0.x, xaxis0.y, xaxis1.x, xaxis1.y );
		}

	}
fixing a bug in makePlotFn
function makeplotfn( pts ) {
	var rfn = function( x ) {
		var ix = Math.round( x );
		if( ix < 0 ) {
			return( parseInt( pts[0] ) );
		}
		if( ix >= pts.length ) {
			return( parseInt( pts[ pts.length - 1 ] ) );
		}
		return( parseInt( pts[ix] ) );
	}
	return rfn;
}
The data files to describe personal geographies
pgeo.xml:
<?xml version="1.0" encoding="utf-8"?>
<path>
<point>
<x>0</x>
<y>0</y>
</point>
<point>
<x>-15</x>
<y>-10</y>
</point>
<point>
<x>0</x>
<y>0</y>
</point>
</path>
kgeo.xml :
<?xml version="1.0" encoding="utf-8"?>
<path>
<point>
<x>0</x>
<y>0</y>
</point>
<point>
<x>-7</x>
<y>40</y>
</point>
<point>
<x>0</x>
<y>0</y>
</point>
</path>
mgeo.xml:
 Games Ever")