How the UFO Numbers Stack-up (Reviewing a Year of Sightings)

 in the United States for one year beginning in July 2011 and ending in June 2012. All charts created using Microsoft Works.")
Canada's Chris Rutkowski and Geoff Dittman compile a UFO Survey each year and the latest one for the year 2011 was issued within the last couple of weeks. That year was almost the highest on record for Canada (these tabulations and analysis of UFO sightings reports for Canada go back to the year 1989). There were just under 1,000 sightings in the year 2011 while there were just over 1,000 in the year 2008. In the US for 2011, there was an average number of sightings for the first half of the year followed by a 1.35Xs jump for the last half of the year (when compared to the previous decade). Based on unfiltered UFO report data from the National UFO Reporting Center (NUFORC) in Washington state, 2012 is expected to set an all time record for reports (since Peter Davenport has directed the effort there in the fall of 1994) as was the case in 2004 and 2008.
The first half of 2012 was 1.57Xs the average for raw reports (again based on NUFORC data). If the trend continues than the last half of 2012 will produce 1.79Xs the usual number of reports (NUFORC had 1.78Xs more reports than a typical June for the June in 2012). That particular June was the highest UFO producing June (with 711 reported events) since Davenport has been at the helm and was the third highest month ever until the next month came along. Now it is the fourth highest month since July 2012 just became the all time UFO sightings month for reports (with 843 events so far) at NUFORC.
One thing that stood out in the Canadian UFO Survey for 2011 was a concentration of "Unexplained" or "Unknown" reports at the end of the analysis. Of the eight reports given, three were clumped together within October 2011. Consistent with that emphasis is the pronounced increase in reports demonstrated by both the data from the Mutual UFO Network (MUFON) and NUFORC as shown in the charts given above and below.
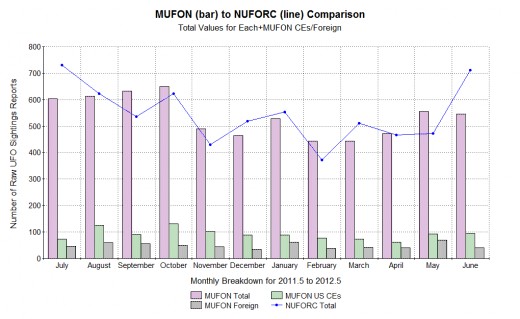
Another noteworthy phenomena is that the NUFORC monthly report totals are usually a bit higher than MUFON's numbers; especially for July 2011 and June 2012 (the differences between the two sets of numbers used to be more pronounced but the gap between them has been narrowing substantially of late). The October 2011 anomaly is one of four exceptions where the relationship was reversed. Both October and August of 2011 had exceptional numbers of Close Encounter reports (as shown extracted from MUFON's numbers), but October's stood out more after the full year was examined closely and about 50% of the events were filtered out (due to insufficient info, having a dubious or unbelievable quality, likely explainable in conventional terms, or duplication).
Related to the October 2011 phenomena is a UFO storm that occurred near Kansas City on October 4th (see my hub http://retrojoe.hubpages.com/hub/ufo-storm-2) and a concentration of stand out reports within a few hours over Denver two weeks later (see my hub http://retrojoe.hubpages.com/hub/Denver-UFOs). I wrote hubs regarding those two events well before it became clear to me that something of major significance overall was up during that month. At the time, I was more interested in events that lined up with peaks in UFO day cycle A (7.1436 days in length; the primary one of three that I have proposed) and those two dates happened to do so.
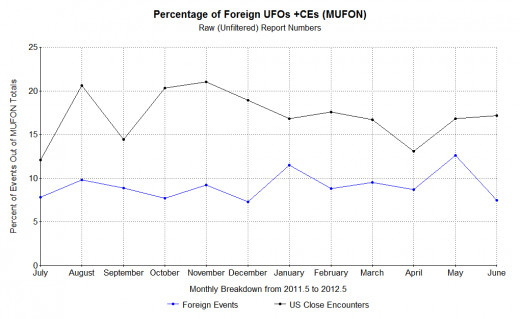
Another stand out month that reveals itself from the data is May 2012. That is one of four months with numbers higher with MUFON than with NUFORC and also produced more foreign reports than for any other month of the study. Interestingly, as can be seen from the analysis of the percentages of Close Encounter (CE) and Foreign reports shown in the MUFON data, there seems to be an inverse relationship between US CE and non-US reports. In months such as January and May of 2012, when non-US reports were elevated, the US CE Reports were just below average. Conversely, August, October, and November of 2011 showed high percentages of CE reports in the US when non-US reports were only moderate (hovering around the average mark). My hub related to UFO activity in May can be found at: http://retrojoe.hubpages.com/hub/May-2012-UFOs-Featuring-Close-Encounters-Daylight-Sightings-and-Days-of-Week
I am about to dive into sorting through the July 2012 UFO report data to get an idea of what it all means. My impression so far is that, although it produced higher numbers than your typical July and was actually the biggest month ever for NUFORC, the results weren't as significant as June 2012 or even May 2012. It is my belief that the spike in reports on July 4th, 2012 was mainly due to a combination of two factors. First, I estimate that at least 8Xs more people were outside to enjoy the festivities than a usual summer day and, second, more people than is typical would likely have been out for the festivities for that particular Independence day due to the extreme heat that was effecting a large part of the country. See my hub "2012 Independence Day Flap Not a True UFO Storm" for a detailed look. Backing my belief is the fact that there were no foreign reports logged at either MUFON or NUFORC on that day. None, even though that day had many times more US sightings than a normal one (a typical day would result in a combined count averaging around 3 foreign UFO reports from the two reporting centers).
In other words, more people equals more potential witnesses to an event and thus more reports. That doesn't equal more true UFO events and thus you get an increase in sightings but also a higher percentage of nocturnal lights that are usually more than half of all reports and are misidentifications 99% of the time. In a true wave of UFO sightings the percentage of events out of the total number of reports that turn out to be "Unknown" (rather than categorized as "IFOs") rises significantly. During an artificial increase, caused by an increase in witnesses and/or UFO hunters, the reverse is usually true. I believe that the noteworthy increases in sightings for June and July 2012 are mostly due to this effect and thus likely more an artifact rather than due to an increase in real events.
June 2012 was the fourth worst drought month on record in the US and the worst month related to how it was hurting the cattle industry in the US since 1952 (yep the year of the biggest US wave of UFO sightings ever). July 2012 was the hottest month in the US since records have been kept in which began in the late 1800s. The past year, ending in June, is also the hottest year ever. More record heat means more people being outside during UFO prime time (8pm to midnight). Again, more people means more reports. I haven't done a breakdown of the percentage of daylight sightings to night-time yet, but when I do I'll bet that, when compared to a true wave year like 1966, 1967, or 1968, the past year will demonstrate a significantly less percentage of daylight reports than for those wave years from the '60s. That to me would indicate a decrease in quality of reports during the latest period of increased activity.
Although it can be predicted with a fair amount of confidence that sightings will increase further till the end of this year, it is unclear if during that time there will be a month similar to October 2011, when not only were the total sightings at a high level but that Close Encounters and Unknowns were also at an exceptionally high level.
© 2012 Joseph Ritrovato