- HubPages»
- Technology»
- Computers & Software»
- Computer Science & Programming»
- Programming Languages
Designing Bezier Curves with Javascript and jQuery - Part 2 in a series

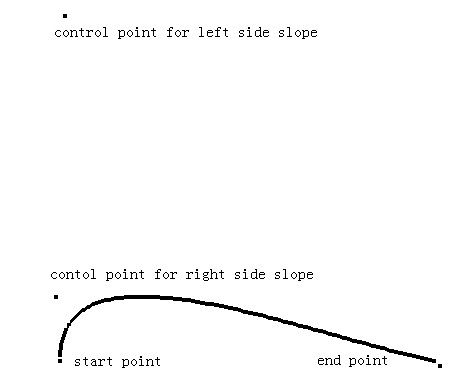
a designed curve
discussion of Bezier curves
Third degree polynomials can be used do describe a wide range of different smooth curves between two points. The trick is in finding the correct coefficients for the polynomials that describes the curve you want. (There is one polynomial per dimension. Here one for x and one for y. ) What is depicted here is a visual method for computing the coefficients. The resulting polynomials are a compact way to describe the curve, you selected.
What is specified are the two end points of the curve, and the first derivative at each end point. The derivatives are sometimes called control points, because their effect is to pull the curve towards the selected point. All specifications are done with a click of the mouse.
From a programming point of view, drawing these curves requires recording a sequence of actions the user does, then manipulating the DOM (document object model) to render the result. In the first hub in this series I covered using jQuery to collect the mouse input. In this hub, I will use jQuery to manipulate the DOM and take actions on behalf of the user.
the control logic
function jgbezier ( drawarea ) {
	var bpoints = new Array();
	var bpointcnt = 0;
	unitsquare.dontscale = true;
	$( "#mousetarget" ).bind( "click", function (e) {
		if( bpointcnt < 4 ) {
			bpoints[bpointcnt] = drawarea.screenCoordinatesToPoint( e.clientX, e.clientY

);
			++bpointcnt;
			if( bpointcnt == 4 ) {
				//draw curve
				var xpath = genbezierequation( bpoints[0].x, bpoints[1].x - bpoints

[0].x, bpoints[2].x, bpoints[2].x - bpoints[3].x );
				var ypath = genbezierequation( bpoints[0].y, bpoints[1].y - bpoints

[0].y, bpoints[2].y, bpoints[2].y - bpoints[3].y );
				$( "#xformula" ).attr( "value", xpath );
				$( "#yformula" ).attr( "value", ypath );
				$( "#jgmeshstart" ).attr( "value", '0' );
				$( "#jgmeshend" ).attr( "value", '1' );
				$( "#start_calc" ).trigger( "click" );
			}
		}
	});
}
discussion of code logic
This function is invoked by a new button on the graphing calculator of my previous series of hubs. It first uses jQuery to register itself to also receive mouse click events on the drawing area, nothing new there. It uses a closure to record the events that it receives until it gets to four clicks. Then it fills in the user input fields of the graphing calculator and clicks the "graph" button.
I could have used native javascript to do all of this, after all jQuery is just a great, big javascript function, but jQuery makes my code simpler and more elegant.
$( <target> ).attr( <attribute>, <value> ) is a lot more direct and self-explanatory way to set the value of an HTML tag's attribute than the equivalent, hand-crafted DOM navigation, for example. I also use jQuery's trigger method to click the"graph" button.
Calculating the polynomial coefficients
function genbezierequation( x0, fx0, x1, fx1 ){
	var a;
	var b;
	var c;
	var d;

	a = x0;
	b = fx0;
	c =  -3 * x0 - 2 * fx0 + 3 * x1 - fx1;
	d = fx1 - 2 * x1 + 2 * x0 + fx0;

	var rval = a + " + x * " + b +  " + x * x * " + c + " + x * x * x * " + d;
	return( rval );
}
Bezier guts explicated
A third degree polynomial is of the form: f(x) = a + bx + cx2 + dx3
The first derivative of this polynomial is f'(x) = b + 2cx + 3dx2
The user will specify f(0), f'(0), f(1) and f'(1) with their clicks. This provides four equations which can be used to solve for the four unknowns a, b, c and d, in terms of f(0), f'(0), f(1) and f'(1). The function above uses the formula from this solution to calculate the coefficients that correspond to a specific set of mouse clicks. The rest is just some syntactic sugar to make javascript happy.
some mechanics for calculating graph points from screen points
function scjgpt( sx, sy ) {
	var rval = new jgpoint();
	rval.x = this.x0 + (( this.x1 - this.x0 )/(this.screenx1 - this.screenx0)) * ( sx -

this.screenx0 );
	rval.y = this.y0 + (( this.y1 - this.y0 )/(this.screeny1 - this.screeny0)) * ( sy -

this.screeny0 );
	return( rval );
}

var jgcoordinatesbase = {
	x0: -1.25,
	screenx0: 50,
	y0: -1.25,
	screeny0: 450,
	x1: 1.25,
	screenx1: 450,
	y1: 1.25,
	screeny1: 50,
	dontscale: false,
	pointToScreenCoordinates: jgptsc,
	screenCoordinatesToPoint: scjgpt,
...
some required mechanics
The only other code that I had to add to my graphing calculator, was a subroutine that converts the screen coordinates, provided by the mouse click event, to the coordinates of my graph.
Notes:
The derivative at f'(1) is actually specified by giving the negative of the actual derivative used in the computation. This is a notational convenience that makes the control points behave symmetrically from the user's point of view.
I had to add support for unary minus to my expression parsing code and fix a bug with the handling of the last term to get this code to work. ( What? Me write a bug? :=)
Next hub in this series, I will try to make the setting of the points more animated.
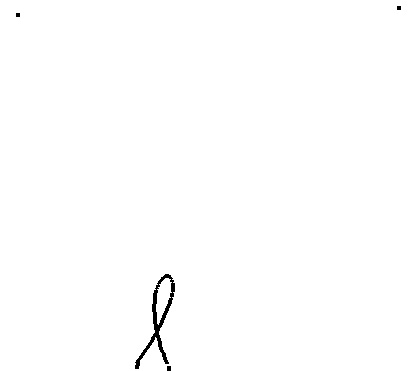
another designed curve

: FOIL & Grid Methods")


