More Help to Ace Your SAT Math Test, Tip #3

Let’s go on to the next level of complexity in applying actual numbers to SAT math problems (beyond equations with one variable or multiple variables). The next test questions feature an equation in each answer choice. It is not unusual for such questions to give you information in a table, a graph, or even an xy coordinate plane. I’ll give two examples here.
Equations in the Answer Choices
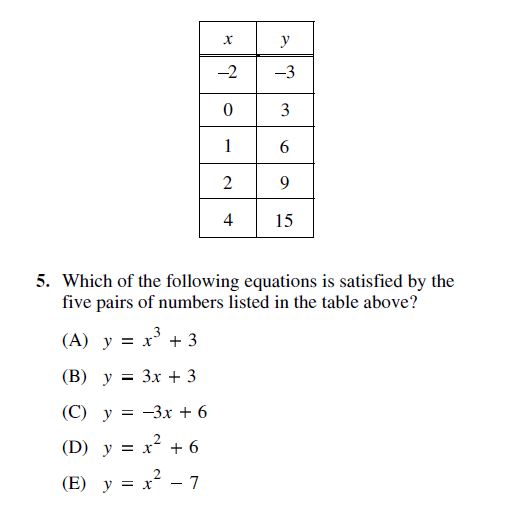
As long as you understand where to plug in which numbers, this first problem is straightforward. In fact, I dare say that applying actual numbers is the fastest way to do this problem (though I’m open to other opinions – leave a comment!). I’m going to plug one of the given pairs of numbers into the equations. The correct answer choice will give me a true equation with each pair of numbers.
Which pair shall I use first? To make the math as easy as possible, I’m going with the pair that includes a zero. (Notice that it’s OK to work with 0 or 1 when the number is given to you. Just don’t pick 0 or 1 when you are making the choice, as I mentioned in the last hub.)
Don't select an answer choice that works; cross off the answer choices that don't.

One important twist with these problems is that the equation has to work with ALL of the pairs of numbers in the table. If you make the mistake of working with only one pair of numbers and selecting the first answer choice that works, you could be picking the wrong answer choice. There’s a big difference in how to handle problems in which the answer MUST be true (like this one) and problems in which the answer COULD be true. In fact, this is such an important distinction that I’ll be writing a separate hub about it.
For MUST be true problems – or problems for which ALL values must work – you’ll want to use the process of elimination. So I’m going to plug in 0 for x (or better yet, just leave out the x term since it equals 0) and 3 for y and cross off any equations that don’t work:
(A) 3 = 3 ✓
(B) 3 = 3 ✓
(C) 3 = 6 ✗
(D) 3 = 6 ✗
(E) 3 = -7 ✗
With one set of values, I’ve already eliminated three answer choices. This means that I only have to plug the next pair of values into the remaining two answer choices. The next easiest pair to work with is x = 1 and y = 6:
(A) 6 = 13 + 3 ✗
(B) 6 = 3(1) + 3 ✓
(C) ✗
(D) ✗
(E) ✗
Only (B) survives, so (B) is the right answer.
Pick Numbers from a Graph
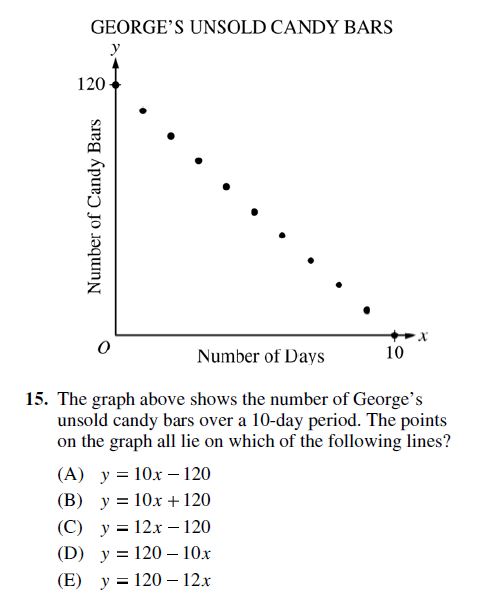
The next problem presents a graph rather than a table, but otherwise the work will be very similar.
Once again, I’m going to pick numbers that are easy to work with (not to mention, easy to identify). So I’ll start with x = 0, at which point on the graph, y = 120:
(A) 120 = -120 ✗
(B) 120 = 120 ✓
(C) 120 = -120 ✗
(D) 120 = 120 ✓
(E) 120 = 120 ✓
I’ve ruled out (A) and (C). Next, I’ll work with y = 0, at which point on the graph,
x = 10:
(A) ✗
(B) 0 = 10(10) + 120 ✗
(C) ✗
(D) 0 = 120 – 10(10) ✗
(E) 0 = 120 – 12(10) ✓
So the answer is (E).
Here’s the summary: When answer choices present equations, plug in a set of given values for the variables and cross off any answer choices for which the equation doesn’t work – that is, for which the equation is not true. When you’re down to one answer choice, you’re done!