How to Value Ipo

Valuation Methods for IPO and Stocks
Valuation of method and methodology for Share Investment
How to read IPO (Initial Public Offering Document) and Its Valuation
“Value” investing at stock markets, Initial public offerings (IPOs), Mergers & acquisitions (M&A) of private Companies
Science – use of valuation models, respecting accounting relationships (e.g. balance sheet equation, clean surplus equation)
Arts – looking into the future
The most we can hope for is an educated guess about what is going to happen with the company in the future, on equity market people essentially compete with their guesses/forecasts
· Company and Promoter Background – This is most important of all value drivers, companies fail and win because of their leaders. This has been proved beyond doubt in the market. The companies which have created great wealth for their investors are best in terms of leadership and social commitment. Background check and history of promoters and directors will help if company is worth investing or not.
· Sector Analysis of the company – The second important factor is state of economy and state of the particular sector of the economy. How the sector performance is most important to look at. The second important growth rate of the sector and long term forecast for the sector. Legal and government policies for the particular sector plays very important role in valuing the companies.
· Fund Manager and Underwriter of the company and their reputation – Who is selling the product is also important. Few lead managers are known for their gimmicks and presenting dubious IPO’s.
· Valuation – The most common and accepted are as follows.
o EPS and P/E
o RoNW
o Peer Analysis and Market Multiples
· Rating – IPO rating is important. Many issues do not take it because of two reasons they are too good or too bad. The percentage of bad not taking Rating is highest so this is first red mark. The issues without rating perform badly, than those with rating. If there is rating then see what it is. Usually offer document put rating and its explanation in small wordings. Be-careful to read it properly.
Income Statement – When looking at income statement read it carefully and sees if there is any extra ordinary income. Also study if there is too much fluctuation in income or any sudden upside before the offering.
Balance Sheet – In the balance sheet see the assets and how they are growing, work in progress and also receivable and payables.
Debt and DSCR – Study how company is leveraged and what the short and long term debts are. High leveraged companies and specially those who take loan just before IPO to show the new projects and growth do not perform well in stock market.
Ownership and Promoter Share and Pre IPO allotment – Another important factor is why money is being raised and what promoters’ interest in raising new capital is. How much stake is for sale? Is there any preference share or debenture or convertible given prior to the IPO and at what price. If there are any mention of Pre IPO transaction, which bought it and at what price are also important are important factor in valuing the company.
Preference share, Convertible Bonds and Debentures and other which will change share holding pattern in long term
Main valuation technique·
Comparable company analysis (Trading comps)
· Value based on trading multiples (earnings, cash-flows) of comparable companies
· Comparable transaction analysis (Transaction comps)
· Value based on trading multiples (earnings, cash-flows) of comparable companies involved in similar transactions
· Discounted cash-flow analysis
· Discounted present value of future cash-flows
Terminology
Equity value - Market value of shareholders’ equity (shares outstanding x current stock price)
Enterprise value- Market value of all capital invested in the firm (Equity, debt ,short-term and long-term, preferred stock, and minority interest)
Multiples - Provide a measure of relative valuation to an underlying financial item Allow for relative comparisons between similar companies and/or similar transactions.
Equity Value Multiples
Certain flows or values apply to equity holders only—these include net income and book value of equity. Since each of these values is after debt and preferred financing is taken into account, multiples of these flows or values should be based on the value of the equity only. Relevant ratios are Equity Value to: Net Income to Common Shareholders, Book Value and Cash Flow
Enterprise Value Multiples
Other flows apply to all capital providers (i.e., debt and equity), and therefore Enterprise Value should be used relevant ratios are: Enterprise Value to: Sales, EBITDA and EBIT
EBIT is Earnings before Interest (interest expense less interest income) and Taxes
Represents the earnings stream (operating income) available to all investors, including debt holders and preferred shareholders before the effects of financing and taxes
Measure of profitability independent of capital structure
In a typical income statement, it is defined as
Gross profit
– Sales, general and administrative (SG&A)
– Depreciation and Amortization (D&A)
– Any other recurring operating expenses/(income)
= EBIT
EBITDA is Earnings before Interest, Taxes, Depreciation and Amortization
Represents the pre-tax operating cash flow available to all investors
“Quick and dirty” approximation of operating cash flow
D&A are non-cash expenses
If D&A are very high, then EBITDA growth must be supported by high capital expenditure
Defined as:
EBIT (as defined above)
+ Depreciation and Amortization
= EBITDA
EPS - Primary before extraordinary items. Watch for stock splits
Cash Flow from Operations - Cash Flow per Share is equal to Net Income + D,D&A + Deferred Taxes (from Statement of Cash Flows) + Other Non-Cash Charges divided by Shares Outstanding
Comparable company analysis values a company by reference to other publicly traded companies with similar operating and financial characteristics. The exact ratios and range analyzed will vary from project to project. Comparable are good for valuing companies in virtually any given industry. Comparable serve as the primary measure of value when analyzing a public offering
Trading comparable
- Determine the peer group (your comps universe)
- Gather the appropriate financial information
- Enter the financial information into your spreadsheet normalize for non-recurring items (why?)
- Calculate relevant historical or forward multiples
(P/E; EV/EBITDA)
Medians are better than means.
Forward multiples are better than historical multiples.
- Forecast your company’s future financial performance
(EBITDA, EPS, Cash Flow, etc.) - Apply appropriate multiples to your company’s financial stats and derive implied valuation range
Even with standard metrics, certain multiples are more relevant for some industries than others, For many industries, EV/EBITDA multiples are the most common trading metric (e.g. Industrials, Transportation, Distribution, etc.), For other industries, P/E multiples are more widely followed (Pharmaceuticals, Restaurants, Biotech, etc.), Financials trade on P/B (price-to-book), Reading analyst reports will help you understand the metrics analysts use to value the sector and the industry
Certain sectors have unique metrics
Telecommunications: Enterprise value to Number of subscribers, Route miles, fiber miles, Access lines
Natural resources: Enterprise value to EBITDAX (Earnings before Interest, Taxes, Depreciation, Amortization and Exploration Expenses), Reserves, Production
Retail/Real estate: Enterprise value to Square footage, EBITDAR (Earnings Before Interest, Taxes, Depreciation, Amortization and Rent)
Getting the comps correct
Ensure you have correctly captured the equity and net debt components ,Diluted shares (includes options and convertibles if in the money),Net debt includes preferred, out of the money converts, capital leases, etc., Ensure your income statement projections are uniform across your comps, Adjust for extraordinary items and one time charges, Calendared so that projections reflect the same time periods, Check analyst projections to make sure they are treating all expense components the same across the comps (e.g., amortization of intangibles)
Determining a value range
Thoughtfully consider the multiple ranges—using the mean/median is not thoughtful, Calculate the value correctly (Firm value versus Equity value issue)
Comparable transaction analysis
Comparisons with similar transactions private market sales of similar businesses, M&A transactions in the same industry as the company (or segment of a company), Price reflects control premiums and synergies
Key factors to consider:
Timing and surrounding events (industry trends), Nature (friendly, contested, hostile), Consideration paid (cash, stock, combination of both), Very similar analysis as trading comps (use of multiples), but a different perspective, Looking at prior acquisitions, insight can be gained as to the premium paid to gain control (i.e., control premium) of the target company, valuation multiples, social issues, and technical transaction elements, In addition, “private market” values sometimes differ from public market values
Measure private market value, including control value, strategic benefits and synergies
- Determine the appropriate deal list
- Gather the appropriate financial information
- Enter the financial information into your spreadsheet calculate Transaction Value (TV) and Offer Value (OV) normalize for non-recurring items
- Calculate relevant multiples (TV/Sales, TV/EBITDA, OV/Net Income, OV/Book Value; Offer Price per Share/EPS)
- Derive implied valuation range
Comparable transactions are where the companies involved have similar business and financial characteristics to the company you are advising
Factors to consider: operations, line of business, size, financial aspects (growth, margins, etc), and consideration paid (market share, technology, etc.)
Timing: Recent transactions are a more accurate reflection of the values buyers are currently willing to pay than acquisitions completed in the further in the past because market fundamentals are subject to dramatic change over the periods of time the then market conditions (industry trends)
Premium (%) = (Offer Price / Target Price) – 1
The idea is to use “unaffected share price” – i.e. prior to announcement of possible sale or before the “evaluating strategic alternatives” press release
Offer Value is similar to Equity Value
Offer Value = Total Shares Outstanding x Purchase Price per Share – Option Proceeds
Total Shares Outstanding = Basis Shares + In-the-money-options + Shares from in-the-money convertible securities
Transaction Value is similar to “Enterprise Value” for acquisition comparable analysis
Transaction Value = Offer Value + Total Debt + Pref. Stock + Minority Interest – Cash & Equiv.
Total Debt excludes convertible securities that are assumed to convert into common shares (do not double count), Relevant multiples will vary by industry
Transaction Value / EBITDA almost always used
Similar to public comparable analysis, unlike trading multiples, acquisitions multiples will generally be higher as they include control premiums and synergies, Last twelve months (LTM) multiples are most common, Also, use forward multiples if possible Could be difficult with private targets
Obtain research with Sales, EBITDA and EPS estimates just prior to the transaction announcement date
Each acquisition is unique and buyers and sellers typically do not know all the factors and motives that went into the formulation of another acquisition price, acquisition multiples often suggest a wide range of values and must be used with care.
Because the acquisition market is not continuous in time, the fact that a particular multiple was paid in the past does not necessarily mean that it still applies today. Unlike the stock market, there is no current P/E benchmark other than the most recent industry transaction which may be several months or even years old.
Many transactions occur at the subsidiary or division level for which no trading valuations exist
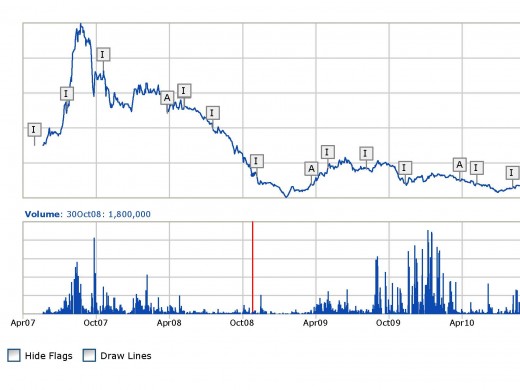
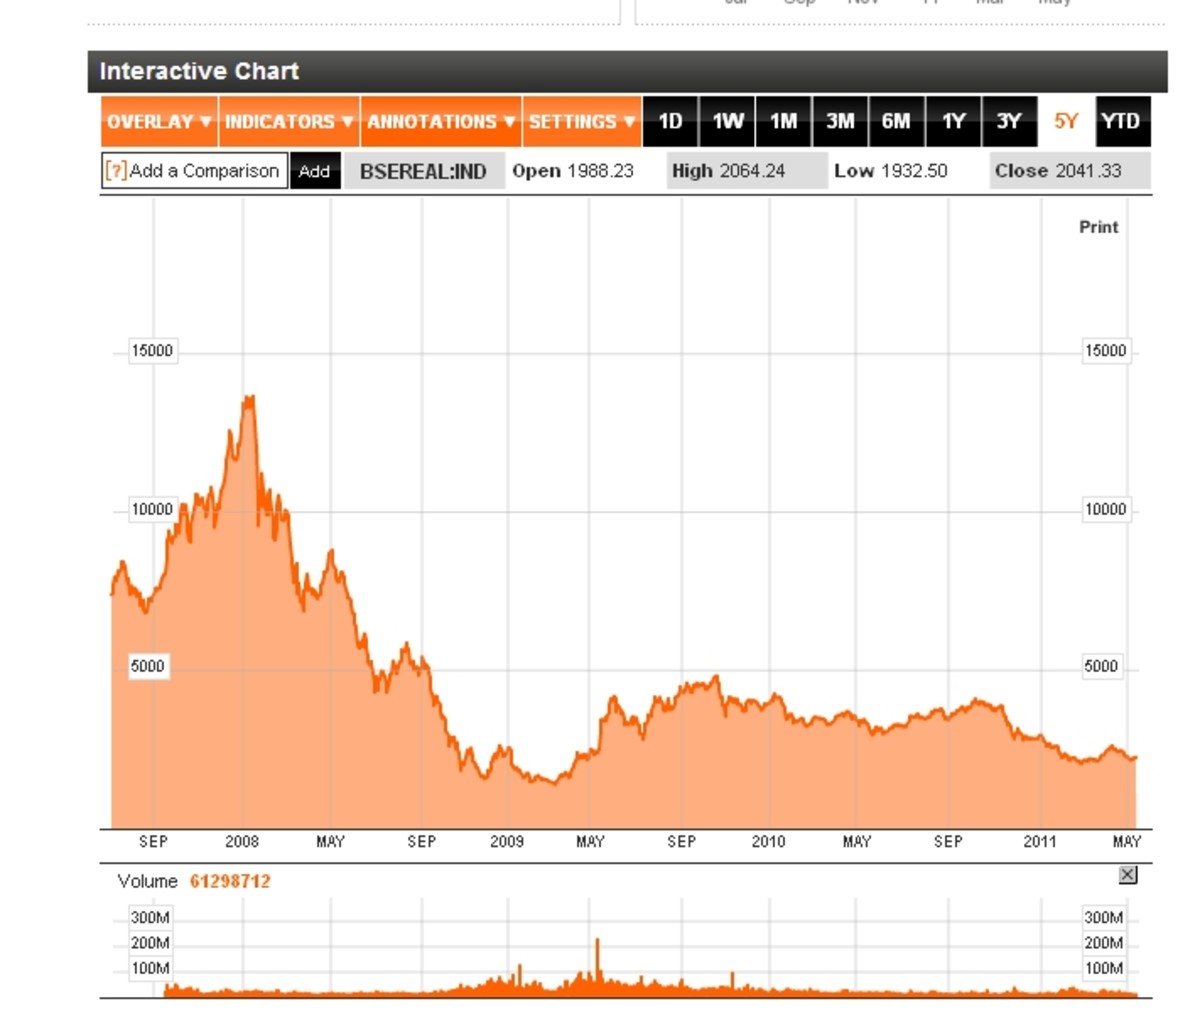
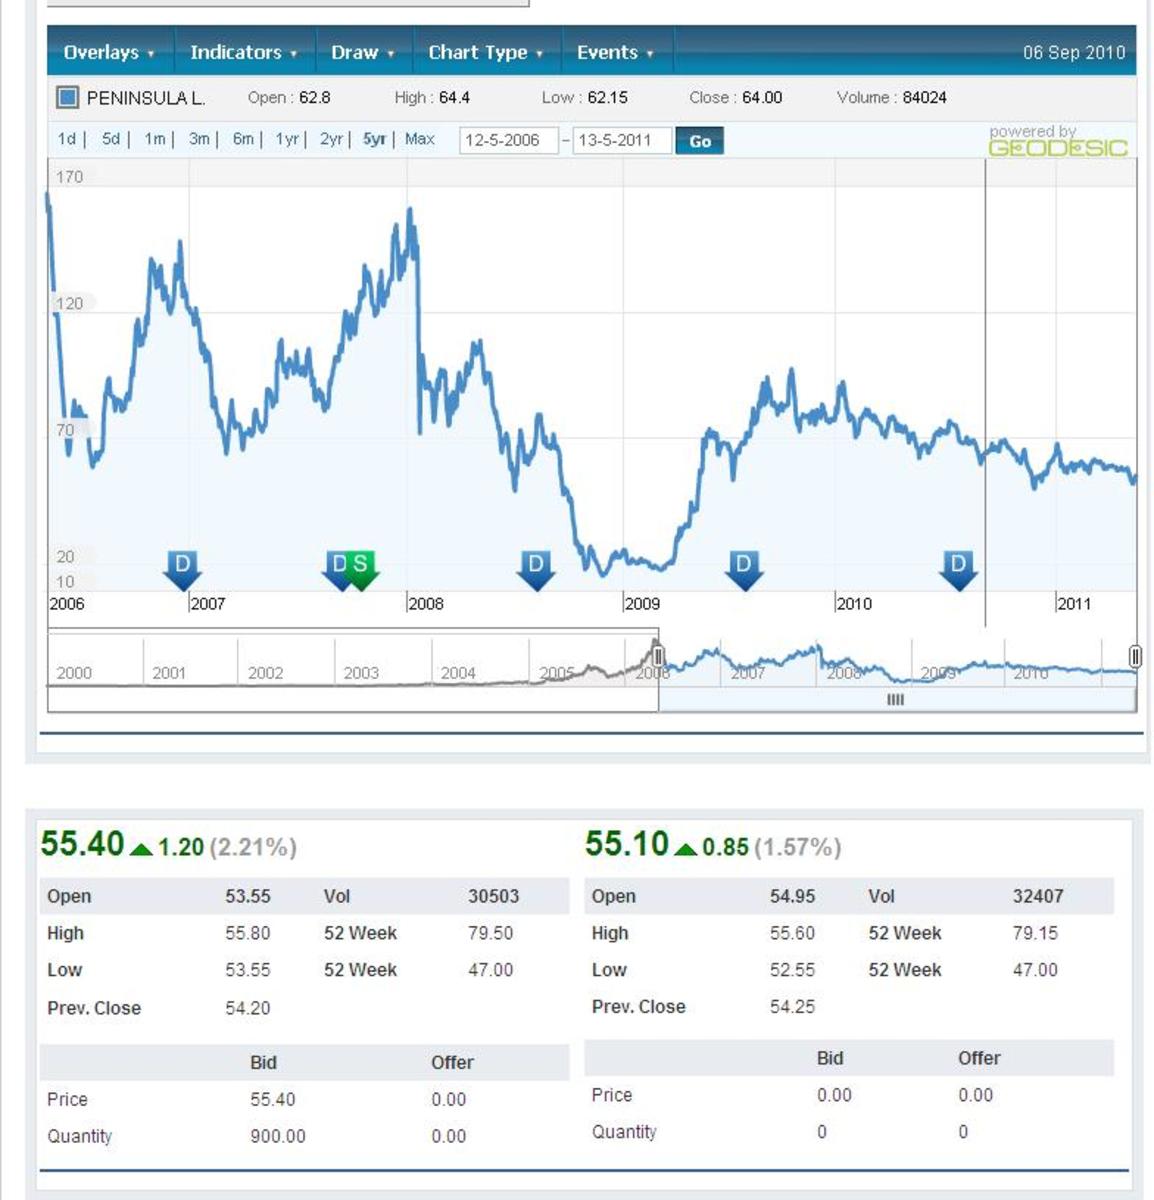
IPO Performance
Related
 System")
A Sensitivity Analysis of the Robert Lichello Automatic Investment Management (AIM) System

High School Graduation and Dropout Rates

How to Haggle a Good Bargain - The Subtle Art of Haggling

Creating an Amortization loan or mortgage schedule using Excel 2007 and Excel 2010

Four Seasons Hotels and Resorts Business Analysis

