OBAMA WINS 2012!! D-58%/R-36% - Now How About 2016?-Hillary Clinton vs Rand Paul? [129*29] (3-18-2013)

LOOKING TOWARD 2014 and 2016
I SEE THIS HUB IS STILL BEING VIEWED at a reasonable rate, that if very gratifying, thank you. With that in mind, I will keep it going with a view toward the next elections for which there are polls already out. Consequently, I will post a couple of my own as well as update many of the tables with the latest poll results.
Below are two lists of popular names, one from the Democratic Party and the other from the Republican Party. The question is who do you want to see replacing Barack Obama in four years, the game is on.
3/16/2013: I see Rand Paul won the C-Pac straw poll.
LOOKING TOWARD THE 2016 PRESIDENTIAL ELECTION WE WOULD LIKE TO KNOW ..
If you voted for President Obama, who would you like to succeed him?
5/10/2013: Hillary Clinton - 10
8/15/15: Hillary Clinton - 10, Joe Biden - 4, Not Sure - 1
If you voted for Governor Mitt Romney, who would you like to replace President Obama?
7/25/2013: Jeb Bush-1, Rand Paul-3
7/25/13: Recent poll (Democratic Public Policy Polls) show the following:
- Rand Paul - 16%
- Paul Ryan - 13%
- Chris Christi - 13%
- Jeb Bush - 13%
- Someone Else - 13%
- Ted Cruz - 12%
- Marco Rubio - 10%
- Bobby Jindal - 4%
- Rick Santorum - 4%
- Susana Martinez - 2%
8/15/15:
- Rand Paul - 6
- Chris Christi - 1
- Jeb Bush - 2
- Someone Else - 3
- Not Sure - 2
THE SENATE RACE
STATE
| DEMOCRAT
| REPUBLICAN
| COMMENT
|
|---|---|---|---|
TOTAL
| 55 (+2)
| 45 (-2)
| |
AZ
| CAMARONA (44%)
| FLAKE (I-45%)
| Too close to call, Camarona has been gaining ground all along
|
CA
| FIENSTEIN (I-53%)
| EMKEN (33%)
| Democratic keeper
|
CT
| MURPHY (50%)
| McMAHON (43%)
| Democratic pickup from in independent
|
FL
| NELSON (I-51%)
| MACK (42%)
| Democratic keeper
|
DE
| CARPER (I)
| WADE
| Democratic keeper
|
HI
| HIRONO (I-55%)
| LINGLE (39%)
| Democratic keeper
|
IN
| DONNOLEY (46%)
| MURDOCK (I-42%)
| Demorcrat gain, passed and is pulling away
|
MA
| WARREN (50%)
| BROWN (I-46%)
| Democratic gain, steadily increasing lead
|
MD
| CARDIN (I)
| BOGINO
| Democratic keeper
|
ME
| Independent KING (50%)
| SUMMERS (35%)
| Republican loss, King will vote with the Democrats
|
MI
| STABENOW (I-54%)
| KOEKSTRA (39%)
| Democratic keeper
|
MN
| KLOBUCHAR (I-61%)
| BILLS (31%)
| Democratic keeper
|
MO
| McCASKILL (I-49%)
| AKIN (41%)
| Democratic keeper, McCaskill pulling away
|
MS
| GORE
| WICKER (I)
| Republican keeper
|
MT
| TESTER (I-47%)
| REHBURG (46%)
| To close to call, Tester pulled slightly ahead and appears to be gaining
|
ND
| HEITKAMP (I-47%)
| BERG (47%)
| To close to call, Heitkamp led all the way until just recently when it became very volitile
|
NE
| KERREY (43%)
| FISHER (53%)
| Republican keeper
|
NJ
| MENENDEZ (I-51%)
| KYRILLOS (35%)
| Democratic keeper
|
NM
| HEINRICH (I-50%)
| MILLER (42%)
| Democratic keeper
|
NV
| BERLKELY (43%)
| HELLER (I-46%)
| Not quite a toss-up, possible Republican keeper
|
NY
| GILLIBRAND (I-65%)
| LONG (24%)
| Democratic keeper
|
OH
| BROWN (I-49%)
| MANDEL (42%)
| Probable Democratic keeper
|
PA
| CASEY (49%)
| SMITH (44%)
| Democratic keeper
|
RI
| WHITEHOUSE (I)
| HINKELEY
| Democratic keeper
|
TN
| CORKER
| CLAYTON (I)
| Republican keeper
|
TX
| SADLER (40%)
| CRUZ (54%)
| Republican keeper although Sadler is making a very strong run, but probably too little. too late
|
UT
| HOWELL
| HATCH (I)
| Republican keeper
|
VA
| KAINE (48%)
| ALLEN (46%)
| To close to call but Kaine has been consistently slightly ahead in most polling
|
VT
| Independent SANDERS (I)
| MaCGOVERN
| Independent votes with Democrats
|
WA
| CANTWELL (I-59%)
| BAUMGARTNER (36%)
| Democratic keeper
|
WI
| BALDWIN (I-48%)
| THOMPSON (46%)
| Toss-up, Thompson gave up lead and is struggling to get it back
|
WV
| MANCHIN (I-66%)
| REASE (27%)
| Democratic keeper, however Manchin is often a Republican vote
|
WY
| CHESNUT
| BARASSO (I)
| Republican keeper
|
THE BOLDED CANDIDATE IS PROJECTED TO WIN
THE U.S. HOUSE RESULTS
STATE
| DEMOCRATIC SEATS
| REPUBLICAN SEATS
|
|---|---|---|
TOTAL SEATS (438)
| 190
| 240
|
ALABAMA (7)
| 1
| 6
|
ALASKA (1)
| 1
| |
ARKANSAS (4)
| 4
| |
ARIZONA (9)
| 1
| 3
|
CALIFORNIA (53)
| 36
| 15
|
COLORADO (7)
| 3
| 4
|
CONNECTICUT (5)
| 5
| |
DELAWARE (1)
| 1
| |
FLORIDA (27)
| 9
| 17
|
GEOGIA (14)
| 5
| 9
|
HAWAII (2)
| 2
| |
IDAHO (2)
| 2
| |
ILLINOIS (18)
| 12
| 6
|
INDIANA (9)
| 2
| 7
|
IOWA (4)
| 2
| 2
|
KANSAS (4)
| 4
| |
KENTUCKY (6)
| 1
| 5
|
LOUISIANNA (6)
| 1
| 4
|
MAINE (2)
| 2
| |
MARYLAND (8)
| 7
| 1
|
MASSACHUSETTES (9)
| 9
| |
MINNISOTA (8)
| 5
| 3
|
NEW JERSEY (12)
| 6
| 6
|
NEW YORK (27)
| 21
| 6
|
NORTH CAROLINA (13)
| 3
| 9
|
NORTH DAKOTA (1)
| 1
| |
MAINE (2)
| 1
| |
MASSACHUSETTES (9)
| 9
| |
MARYLAND (8)
| 7
| 1
|
MINNESOTA (8)
| 5
| 3
|
MISSISSIPPI (1)
| 1
| 3
|
MISSOURI (8)
| 2
| 6
|
MONTANA (1)
| 1
| |
NEBRASKA (3)
| 2
| |
NORTH CAROLINA (13)
| 3
| 9
|
NORTH DAKOTA (1)
| 1
| |
NEVADA (2)
| 1
| 1
|
NEW HAMSHIRE (2)
| 2
| |
NEW JERSEY (12)
| 6
| 6
|
NEW YORK (27)
| 21
| 6
|
NEW MEXICO (3)
| 2
| 1
|
OHIO (16)
| 4
| 12
|
OKLAHOMA (5)
| 0
| 5
|
OREGON (5)
| 4
| 1
|
PENNSYLVANIA (18)
| 5
| 13
|
RHODE ISLAND (1)
| 1
| |
SOUTH CAROLINA (7)
| 1
| 6
|
SOUTH DAKOTA (1)
| 1
| |
TENNESSEE (9)
| 2
| 7
|
TEXAS (36)
| 12
| 24
|
UTAH (4)
| 1
| 3
|
VERMONT (1)
| 1
| |
VIRGINIA (11)
| 3
| 8
|
WASHINGTON (10)
| 6
| 4
|
WEST VIRGINIA (3)
| 1
| 3
|
WISCONSIN (8)
| 3
| 5
|
WYOMING (1)
| 1
|
THE COMPETITORS


THE RACE BEGINS
AND SO IT STARTS, the race between President Obama and Governor Mitt Romney for the Presidency to begin in January 2013. Like my other hubs of this nature, I will provide commentary for those who are interested as well as provide a poll where I hope I can get more than 29 votes this time; but, if I don't, so be it. Also presented is a table of all of the states with their electoral votes and my view as to who is likely to win the state. At this point in time, April 10, 2012, I give it to President Obama 335 to 203. Even if you exclude the states I don't put in the "for certain" column, Obama still beats Romney, 309 to 140, more than enough to win. By comparison, I saw on CNN this evening that they have President Obama scratching out a win ... maybe.
As always, the outcome is going to depend on 1) how much of the base each Party can deliver and 2) who can win the independent voter. The dynamics are extremely interesting in that on the Conservative, they are not going to have a candidate they like in Romney; the further right you go, the less they like him, especially as he tracks left to win back some independents. On the Left, Obama has issues keeping his liberal wing interested in voting as they less and less see him as one of them. I believe, a lot is going to ride on who the independents blame more for the gridlock in Congress and do they want more of the same; for the choice is clear, vote in the kind of Congress we have today, and you will have four more years of gridlock, regardless of who wins the Presidency or vote in moderate Republicans and the standard fare of Democrats and get the country running again. The third alternative can't happen because not enough Democratic seats are up for grabs to give the Conservatives a veto-proof majority in the Senate. So, there you have it.
5/2/2012: Things are not looking great for Mitt Romney at the moment. With each new state coming in with a poll result, Obama is getting the majority, today it was Nevada. At the moment, I have Obama winning 28 states and D.C. and 352 electoral votes compared with Romney's 23 states and 186 electoral votes.
5/4/2012: The National Polls haven't changed much over the last 30 days; Obama has ranged from between 46% to 48% while Romney has scored between 43% and 47%.
5/9/2012: It is interesting in that as the National Polls have Obama and Romney getting closer together, the State-by-State polls have Obama still winning handily. Currently my estimate is Obama winning 28 states and D.C., with 323 electoral votes compared to Romneys 23 and 209
9/13/2012: Four months and four days have gone by, so have the two political conventions; so what has changed ... not much! And, that is probably not good for Mitt Romney as he has exhibited no signs of building momentum going into the final 55 days. By my count, Obama will still win by 301 to 237 electoral votes. Let's take a peek at how the candidates are doing with the other metrics to see what they tells us.
10/20/2012: Debates #1 and #2 have come and gone; #3 is in two days. The poll numbers clearly reflect the results of the first debate but, since the latest polls only go through 10/18, they don't yet assess Obama's much better performance in the second debate. What the polls clearly show is the disaster from Obama's poor performance, combined with Romney great performance in the first debate. In my opinion, Obama won on substance but that was so overshadowed by such a dramatic contrast in style, it really doesn't make any difference. Romney did best in Florida and North Carolina so far where he jumped out in front of Obama who had actually pulled ahead a little in those states. It didn't seem to hurt him in Nevada and Ohio while Colorado and Virginia are in-between. Romney's biggest boost came in favorability where he did one of his famous flip-flops, going from more disliked than liked to the reverse.
METRIC
| RESULT
| OBAMA TREND
| ROMNEY TREND
|
|---|---|---|---|
Economy is Getting Better
| YES-49% / 47%-NO
| POSITIVE
| NEUTRAL - NEGATIVE
|
Opinion on Obamacare
| APPROVE vs OPPOSE: -14
| FLAT - NEGATIVE
| FLAT - POSITIVE
|
Opinion on Obama about Health Care
| APPROVE vs OPPOSE: -7
| POSITIVE
| NEUTRAL
|
Party Identification
| DEM-32%, IND-37%, REP-23
| POSITIVE
| NEGATIVE
|
Satisfication
| SATISFIED-33% / DISSATISFIED-64%
| POSITIVE
| NEUTRAL
|
Right Track / Wrong Direction
| RIGHT-41% / WRONG-53%
| POSITIVE
| NEUTRAL
|
Obama -Romney Head-to-Head
| OBAMA-48% / ROMNEY-47%
| NEUTRAL
| NEUTRAL
|
Obama Favorability
| 49% - 47%
| POSITIVE
| NEUTRAL
|
Romney Favorability
| 47% - 47%
| NEUTRAL
| NEUTRAL
|
Obama Job Approval
| 49% - 48%
| NEUTRAL
| NEUTRAL
|
% Electoral Count > 0 in a State
| OBAMA-56%/ROMNEY-44%
| CUSHION OF 5%
| DEFICIT OF 7%
|
% Electoral Count > 2 in a State
| OBAMA-51%/ROMNEY-39%
| CUSHION OF 0%
| DEFICIT OF 12%
|
% Electoral Count > 3 in a State
| OBAMA-47%/ROMNEY-36%
| DEFICIT OF 4%
| DEFICIT OF 15%
|
A LOOK AT THE CLOSING DAYS
NEAR CERTAIN WINS
| ALMOST CERTAIN WINS
| MAYBE WINS
| TOSS UPS
| |
|---|---|---|---|---|
OBAMA
| CA, CT, DC, DE, HI, IL, MA, MD, ME, NJ, NM, NY, OR, PA, RI, VT, WA, - 211
| MI, MN, WI - 36 (247)
| IA, NV, OH - 30 (277) (Winner)
| CO, NH
|
ROMNEY
| AK, AL, AR, GA, ID, IN, KS, KY, LA, MO, MS, MT, ND, NE, OK, SC, SD, TN, TX. UT, WV, WY - 180
| AZ - 11 (191)
| FL, NC, VA - 57 (248)
| CO, NH - 13 (261)
|
WHAT IF# 1?
| WINS
| |||
OBAMA
| CA, CT, DC, DE, HI, IL, MA, MD, ME, MI, MN, NJ, NM, NY, OR, PA, RI, VT, WA, WI - 247
| CO (9), IA (6), NH (4). NV (6) - 272 Winner
| ||
ROMNEY
| AK, AL, AR, AZ, GA, ID, IN, KS, KY, LA, MO, MS, MT, ND, NE, OK, SC, SD, TN, TX. UT, WV, WY - 191
| FL (29), NC (15), OH (18), VA(13) - 266
| ||
WHAT IF# 2?
| ||||
OBAMA
| CA, CT, DC, DE, HI, IL, MA, MD, ME, MI, MN, NJ, NM, NY, OR, PA, RI, VT, WA, WI - 247
| OH (18), NV (6) - 271 Winner
| ||
ROMNEY
| AK, AL, AR, AZ, GA, ID, IN, KS, KY, LA, MO, MS, MT, ND, NE, OK, SC, SD, TN, TX. UT, WV, WY - 191
| CO (9), FL (29), IA (6), NC (15), NH (4), VA(13) - 267
| ||
WHAT IF# 2?
| ||||
OBAMA
| CA, CT, DC, DE, HI, IL, MA, MD, ME, MI, MN, NJ, NM, NY, OR, PA, RI, VT, WA, WI - 247
| FL (29) - 276 Winner
| ||
ROMNEY
| AK, AL, AR, AZ, GA, ID, IN, KS, KY, LA, MO, MS, MT, ND, NE, OK, SC, SD, TN, TX. UT, WV, WY - 191
| CO (9), IA (6), NC (15), NH (4). NV (6), OH (18), VA(13) - 262
|
AS YOU CAN SEE, IT IS VERY HARD FOR GOVERNOR ROMNEY TO PUT TOGETHER A WINNING COMBINATION OF ELECTOR VOTES
WHO ARE THE READERS OF THIS HUB
I HAVE A COUPLE OF DEMOGRAPHIC SURVEY polls at the bottom of this Hub I inserted not too long ago in order to get an idea of who my readership was. I can use this information not only for my own curiosity, but interpreting my other polls as well. Currently I have around 47 results in each of the two polls with is enough to start forming an idea. I though I would share it up at the top of the Hub since I imagine many of you don't get all of the way to the bottom of what has become a rather lengthy Hub.
One question is whether you are Female or Male. Right now it breaks down to 42% female readership and 58% make readership (I didn't include a "Not Sure" category for this question, lol.)
The other question was on political orientation, and to be honest, I was both surprised and pleased. Given my other Hubs, and to a small degree, this one, I show a distinct bias away from the Right (there are some of the Left who put me in the Conservative camp, so that is why I phrase it so oddly). Therefore, my going in assumption was that my Conservative readership might be suppressed; it wasn't, I am happy to report. The percentages follow national tendencies, Progressives - 26%, Moderates - 36%, and Conservatives - 38%.
NEW QUESTION!!
DO YOU FEEL THE ECOMONY IN 2013 IS GOING TO GET BETTER or WORSE?
FOR BETTER OR WORSE
8/2/2012: I FIND IT VERY INTERESTING AND UPLIFTING that those of us in Hubland have a much more optimistic view of the American economy than the nation as a whole. This is especially given the readership of this hub is roughly evenly split between Conservative and Progressive leaning readers. At 49%/44%/7%, this is as close as it has been so far, the bias is toward the readers thinking the economy is getting better. I say "bias" because with the numbers I currently have, the difference between the two is not statistically significant at the 95% confidence level.
However, comma, what is statistically significant is the difference in results from my little poll and the average of the national polls which currently stands at 34%/61%/ (no opinion) 5%. Could random chance account for such a difference in results? ... not a chance; maybe Hubbers know something others don't?
8/8/2012: Shortly after writing the above note, the "getting worse" votes came flooding in and, while still showing no statistical difference, the bias in hubland swung dramatically toward "the economy is going to get worse in 2013."
8/18/2012: I see the "getting better" votes picked back up again and are ahead 46%/44% with 96 votes; how interesting.
8/25/2012: There are 109 votes now and the results are 46%/44%/10%. That many votes is starting to mean something now, especially when compared to the national results of 31%/64%/5%. The first thing I notice is that in my poll, statistically speaking, about 1/2 the hubbers who read this kind of hub think the economy is getting better and the other half don't; what is certain though is that they have an opinion.
As do those in the national poll except that it is clear the population generally feels the economy is getting worse. It is also evident that the populations in the two polls aren't the same in some respects. What is interesting for people like me is to try to guess at the differences and see if they tell me anything.
So, what can I reasonably surmise? The readership of this hub probably:
- likes to read and write more than the general population, that is why they are here. and therefore might be somewhat better educated (which is in-line with the answer to some education level surveys in other hubs, btw)
- are more interested in the world around them than the general population, that is why they took time to read this hub and to vote.
- has the same cross-section of progressives, moderates, and conservatives as the general population, judging from my Demographics #1 survey; if anything, it is probably weighted a little to the conservative side.
That is all I can think of at them moment, but it is enough to offer this hypothesis - "The more educated and engaged you are, the more likely you are to be optimistic about our economic future."
9/2/2012: There are now 151 votes, solidifying the idea that Hubbers and guests see the economy more positively than the general population. With a 42%/43%/15% result, it is getting pretty certain the voting population see a brighter future for the American economy when compared with the 37%/56%/7% result from the population as a whole.
9/7/2012: Around the 190 vote mark, there was a noticeable uptick in positive votes. With 218, it now stands at 48%/39%/14%. While still significantly different from the national Gallup poll results, it is momentarily consistent in that the Gallup poll also show an obvious improvement in outlook. If it holds, that is not good news for Mitt Romney.
11/1/2012: The national polls are finally catching up to the Hub polls. The Gallup 3-day moving daily tracking poll moved into positive territory for the first time ever for President Obama showing 49% of Americans now have a positive outlook on the economy vs 47% who have a negative outlook.
IS ECONOMY GETTING BETTER OR WORSE?
12/13/2012
| 11/1/2012
| 10/25/2012
| 10/18/2012
| 10/14/2012
| 10/2/2012
| 9/28/2012
| 9/19/2012
| 9/17/2012
| 9/4/2012
| 9/2/2012
| 8/24/2012
| 8/11/2012
| 8/1/2012
| 6/1/12
| 5/14/2012
| 8/10/2011
| 5/13/2009
| 10/5/2008
| |
|---|---|---|---|---|---|---|---|---|---|---|---|---|---|---|---|---|---|---|---|
GETTING BETTER
| 45%
| 49%
| 45%
| 43%
| 40%
| 37%
| 41%
| 42%
| 44%
| 42%
| 35%
| 37%
| 34%
| 36%
| 38%
| 44%
| 17%
| 36%
| 8%
|
NOT SURE
| 5%
| 4%
| 7%
| 5%
| 5%
| 8%
| 4%
| 4%
| 5%
| 5%
| 5%
| 7%
| 5%
| 5%
| 5%
| 5%
| 4%
| 7%
| 3%
|
GETTING WORSE
| 50%
| 47%
| 48%
| 52%
| 55%
| 55%
| 55%
| 54%
| 51%
| 53%
| 60%
| 56%
| 61%
| 59%
| 57%
| 51%
| 79%
| 57%
| 89%
|
GALLUP DAILY TRACKING POLL (3-day moving avg)
POLLS ON OBAMACARE
WITH THE DECISION BY THE SUPREME COURT regarding which parts of Obamacare were Constitutional and which were not, plus given the fact that it is one of the hottest of hot button issues for Conservatives, I thought I might present a couple of polls out on the Internet, plus ask one of my own.
WHAT IS YOUR OPINION REGARDING OBAMACARE?
DO YOU THINK OBAMACARE SHOULD BE -
VOTES - 327: KEEP - 186, REDUCE - 20, KILL - 108, NOT SURE - 13
9/2/2012: With 61 votes, three things are for sure, Hubbers and guests 1) have a strong opinion on this, i.e., Keep or Kill; 2) are split whether to "keep as is" or "make stronger" as opposed to "kill and forget about it" or "kill and try again", 3) differ significantly from the general population as you can see from the tables below. The question, of course, is why is Hubber and guest population different than the general population and is more inclined to favor Obamacare?
9/5/2012: With 77 votes, I am impressed with the 30% who want to Enhance Obamacare. I wanted to point this out because when you drill down into the national poll numbers as to who likes or dislikes (agrees with or disagrees with) Obamacare, you will find a significant portion of the disgruntled voters are that way because Obamacare didn't go enough and not, as top number and many who oppose Obamacare would like you to believe, that majority of Americans oppose the idea of Obamacare. If fact, the majority of Americans like Obamacare in principla, it is just that many don't like it, as you see in this poll, because it is too weak.
9/14/2012: With 152 votes, and the way Conservatives, Moderates, and Progressives are split in this hubs readership, the 31%/22%/7%/17%/20%/3% results are becoming a prettly clear indication that the moderate voter is breaking, in relatively large numbers, toward keeping Obamacare or improving it.
HOW THE NATION FEELS ABOUT OBAMACARE
SEP 12, 2012
| AUGUST 2012
| JULY 2012
| JUN 2012
| MAR 2012
| DEC 20011
|
|---|---|---|---|---|---|
OPPOSE -14
| OPPOSE: -12
| OPPOSE: -12
| OPPOSE: -15
| OPPOSE: -14
| OPPOSE: -17
|
HOW NATION FEELS ABOUT OBAMA ON HEALTH CARE
12/10/2012
| 10/29/2012
| 10/22/2012
| 10/15/2012
| 9/26/2012
| 9/17/2012
| 9/10/2012
| 9/3/2012
| 7/30/2012
| 11/22/2011
| 11/10/2012
| 2/2/2012
| 6/21/2009
| FEB 19, 2009
|
|---|---|---|---|---|---|---|---|---|---|---|---|---|---|
DISAPPROVE -1
| DISAPPROVE -7
| DISAPPROVE -10
| DISAPPROVE -11
| DISAPPROVE -12
| DISAPPROVE -13
| DISAPPROVE -13
| DISAPPROVE: -14
| DISAPPROVE: -16
| DISAPPROVE: -22
| DISAPPROVE: -7
| DISAPPROVE: -18
| EVEN
| APPROVE: +18
|
MITT ROMNEY'S RUNNING MATE
I SAW THIS ON REALCLEARPOLITICS except it turned out to be an ad which wanted me to sign up for a conservative newsletter I didn't want, so I passed it on by. Nevertheless, it is an interesting question and curious minds would like to know what you all think about it, so I offer the most promising or interesting names I saw on the rather extensive list provided on the advertisement.
8/4/12: I find it interesting that 2nd Place is "Someone Else" at 20% of 59 votes so far with Marco Rubio in 1st with 32%. Given the depth of the list of choices, I wonder who I forgot, if it is one person the voters are thinking about?
Who would you like to see as Mitt Romney's Vice Presidential Running Mate?
- 3% Gov RIck Perry
- 17% Gov Sarah Palin
- 3% Gov Tim Pawlenty
- 28% Sen Marco Rubio
- 0% Gov Susan Martinez
- 8% Rep Paul Ryan
- 3% Gov Chris Christi
- 0% Sen John Thune
- 0% Sen Jim DeMint
- 0% Gov Mitch Daniels
- 3% Sen Rob Portman
- 9% Secretary Condoleezza Rice
- 3% Gov Bobby Jindal
- 5% Gov Nikke Haley
- 18% Some one else
This poll is now closed to voting.
Just so you don't have to convert in your head: 65 votes
- Rubio - 18
- Some on else - 12
- Palin - 11
- Rice - 6
- Ryan - 5
- Haley - 3
- Perry, Pawlenty, Christi, Portman, Jindal - 2 each
The last few days before Mitt Romney announced Paul Ryan as his VP choice, Condaleeza Rice picked up one vote and Paul Ryan three. Consequently, this is a small sampling of how those in Hubland saw how it should be.
As to Mitt Romney's choice ... in my opinion, he just sealed the deal for Barack Obama winning his second term. While Paul Ryan has proven himself a much more capable and knowledgeable politician, by an order of magnitude, over Sarah Palin, and he doesn't come with his foot in his mouth, Ryan is nevertheless very polarizing. His Ryan budget plan with its anti-Medicare provisions should hand Florida over to Obama as the near 65 and older crowd either don't vote or vote for Obama in order to protect Medicare. If there is a large population of older Americans in other swing states, that might be enough to ensure an Obama win there, just on that single issue.
A plus for Ryan is he is not particularly anti-gay, like most Conservatives; he understands homosexuality is genetic-based and not a choice. To prove it, he broke with his Party in a vote regarding discrimination against gays, he voted not to discriminate. I don't believe Romney is particularly anti-gay either but both are definitely against gay marriage. Nevertheless, that may blunt Obama's advantage there.
Other than that, it comes down to philosophy: President Obama believes that the "general Welfare" clause in the Constitution means one thing, Romney believes it doesn't mean anything at all; views on Liberty are distinctly different; Obama believes strongly in a United States while Ryan, with Romney in tow, believes more in a Continental Congress-type united States (given Romney's Mormonism, I actually don't believe is real views go that far); how each views Justice and Tranquility are certainly different as well. The only point of agreement is where Democrats are often weakest, and that is "the common defense", but in this case, that is probably Obama's strongest suit.
THAT WAS MY VIEW, WHAT IS YOURS?
DID MITT ROMNEY MAKE THE RIGHT VP CHOICE IN PICKING PAUL RYAN?
After 256 responses, 87 think Paul Ryan will help the Republican ticket and 108 don't. 30 people don't think it will make any difference and 31 are not sure.
VOTE EARLY, but not often.
WHO DO YOU THINK YOU WILL VOTE FOR IN NOVEMBER 2012?
- 2% NOT VOTING
- 58% BARACH OBAMA
- 36% MITT ROMNEY
- 3% SOMEBODY ELSE
- 2% DON'T KNOW YET
This poll is now closed to voting.
COMMENTS ON POLL RESULTS
VOTES: 598; OBAMA - 341, ROMNEY - 215, Somebody Else - 18, Not Sure - 12, Not Voting - 12
5/4/2012: Democrats, don't get your hopes up yet that if America votes the way hubbers are that Obama is a shoo-in, he isn't. With only 33 votes and a 52%/36% result, using a 95% level of confidence, the margin of error is 32%, which means Obama and Romney are in a statistical tie, lol.
5/9/2012: To give you a little insight into the Margin of Error thing, it depends on two things, 1) the number of votes, obviously, but 2) what the results actually are. In out case, 8 more votes were added and if the results were the same as before, i.e., 52%/36%, the margin of error would be 28.6%, down from the previous 32%. But the current vote is 49%/39%. Because the votes got closer together, that increases the margin of error ever so slightly to 28.9%. In either case, Obama and Romney are in a statistical tie for this poll.
5/31/2012: The Obama-Romney Head-to-Head poll is interesting to look at in detail and in graph form such as on the Huffingtonpost.com website. I will try to describe a little of what I see. From Aug 2011 through Jan 2012, Obama and Romney had been running parallel with each other with Obama around 2.5 points ahead. Then Obama started gaining in popularity while Romney started losing until mid-February, Obama was 6 points ahead. Things reversed themselves at that point with Romney closing the gap until he was only .8% behind Obama in an average of several polls on May 15th. Once again, the pattern reversed and today, Obama is now 2 points ahead again.
What was going on during those various periods? I won't try to assign causes, but as I recall you had Romney getting beat up pretty badly by his opponents but then finally pulling through with all of them dropping out. Obama was facing a noticeably improving economy only to be overtaken by rising gas prices and then a slowdown in employment. Recently, gas prices are tumbling although employment is still sluggish but retail sales are strong.
In looking at the state polls over the last several months, Obama still has a very comfortable electoral college lead, but it is softening somewhat. I don't quite understand why all of the pundits keep saying it is a neck-and-neck race, to me, the individual state numbers aren't telling that story ... at the moment.
6/4/2012: TRENDS - There are only five months to go before what may be a historic election and I want to talk a little bit about where I believe things stand at the moment. Most of you who follow me know that 1) I lean to the left a little bit, but 2) I try to provide unbiased, thoughtful opinion based on analysis and not dogma or parroting a popular position of one side or another. My thoughts here are no different, even though they may be a bit contrarian.
For starters, I think things may be moving in the Democrats direction, maybe not Obama's, but the Democrats in general. My main reason for thinking so is what is happening with the party identification trend. While the movement is decidedly slow, it is constant and certain. Little be little, the Democrats have been gaining strength and it has come primarily from independents and a little from Republicans. This trend began in December 2011 and has been accelerating for the Democrats and independents ever since.
Another thing in favor of the Democrats and Obama, at the moment, is the economy. Yep, you heard me right, the economy. My reasoning is thus: just as the rapidly rising gas prices hurt the economy and Obama buy taking money out of the economy, the rapidy falling gas prices should do the reverse, put money back into the economy. Only time will tell, but I bet you will see those poll number which depend on citizens feeling good about things will start to go up again; which only help the Democrats. It is already showing in retail sales. Even as the poor unemployment numbers were recently being reported, retail sales were being reported as being very strong. (BTW, did you know, Obama's first time unemployment numbers are currently no worse than most of Nixon's administration, the first terms of Reagan, and Bush II's administrations, or the last two years of Bush I's administration?)
Politically, the Democrats seem to be gaining strength in the House and Senate races. Once it was certain the Democrats could not win back the House, and there was a reasonable chance they would lose the Senate. Today, there is a chance they might actually win a majority in the House and the chances of the Republicans winning the Senate look slim.
As to Obama and Romney, the odds are still high that Obama is going to win; primarily because he has such a lead in electoral votes and Romney doesn't seem picking any states or even reducing Obama's lead in many of them. Obama must lose AZ (ahead by 2), NV (ahead by 6), OH (ahead by 4), and VA (ahead by 4) to lose to Romney.
However, at least people are looking more favorably on Romney, his favorability rating is trying to catch up to his unfavorable rating, which is rising as well, but just not as fast. Obama's favorability and approval ratings are holding steady, as they have for the last several months. It will be interesting to see how the recent decline of gasoline prices will affect them, I would think it would drive them in positive directions.
6/7/2012: With 56 votes and a 59%/32% spread between Obama and Romney, I can now say there is a statistically significant difference in the preference of those who have voted using a 5% level of confidence. The margin of error is 24%.
6/10/12: With 60 votes and a 58%/33% spread between Obama and Romney, respectively, I end up with a 23% margin of error. Given my poll is unscientific in nature, meaning my sampling is not necessarily random, it could accidentally be that way, but not necessarily, I can say one of four thing about the results: 1) IF hubland represents a cross-section of America and IF those who read this hub are a cross-section of hubland and IF those who voted in the poll are a true cross-section of those readers, then the results should be how America truly feels at the moment; 2) IF those who read this hub are a cross-section of hubland and IF those who voted in the poll are a true cross-section of those readers, then the results should be how hubland truly feels at the moment; 3) IF those who voted in the poll are a true cross-section of the readers of the hub, then the results should be how readers truly feels at the moment; 4) the results show the party bias of those who voted in the poll, since I don't know how many Republicans, or right-leaning Independents, or their opposites numbers voted and how they voted. Given the lop-sided results in this poll and results I have received in other polls, I tend to feel my readership is pretty balanced so I think there are more left-leaning people voting than right-leaning people voting and that Hubland is not a good sample of a cross-section of America.
6/11/12: Republicans must have read my last post, I picked up three more votes and I think 2 went for Romney and 1 went for Obama. To show how, with these low vote totals, sensitive the statistics are, even though I gained three votes remained the same at 23%; that is because the spread between the two candidates decreased to 57%/35%. Both factors, count and spread, enter into the equation for margin of error. As a result, that left the MOE at 23% and threw the vote back into a statistical tie once more. In other words, not to get too statistical on you, there is a 95% probability that Romney's true results, if you surveyed the whole country, could be as high as 59.2%, which includes Obama's 57%, while Obama's result "could" be as low as 33.8%, which includes Romney's 35%. That is what is meant by being "within the margin of error".
6/22/2012: Eleven more days have passed and 25 more votes have come for a total of 88. The vote is 57%/35% with a MOE of 20%, which, as you can see is less than the difference between the two candidates meaning Obama is once again statistically ahead of Romney in hubland, with, of course, all of the caveats I mentioned before.
7/13/2012: Romney has surged, so to speak. Voting has picked up, thank you very much, and we have 119, which is starting to approach a respectable number, statistics-wise. All I am missing is the randomness of my sample, unfortunately, so I need lots more votes to make up for that. Anyway, even though my votes have grown by around 30%, the margin of error only decreased by 3 points to 17%. That is because Romney closed the gap from 57-35% to 54-40%, which puts him back into a statistical tie once more. Isn't that interesting.
Also interesting is that I put a couple of demographic questions at the bottom of this hub to help better gauge the results. So far, nobody has identified themselves as progressives, only moderates and conservatives.
7/20/2012: There aren't quite as many votes in the VP poll as I thought there might have been by now, but what ones there are, are nice and diverse. I picked Pawlenty myself, because I thought he would do Romney the most good, overall. My second choice would have been Rice and I am happy to see she is second at the moment. I feel the rest are simply too polarizing for the country as a whole although they may be more acceptable to the conservative base.
8/1/2012: I just looked over the Senate polls and here is the way I see those shaping up at the moment:
- Democratic Seats Not Up For Election: 29
- Democratic Safe Seats: 18 (including two independent seats)
- Seats Leaning Toward Democrats 5
- Total 52
- Republican Seats Not Up For Election: 37
- Republican Safe Seats 6
- Seats Leaning Toward Republicans 5
- Total 48
8/16/12: Just so you know, it is still a statistical tie, but barely, between Obama and Romney. With 237 votes, it is down to the 12% margin of error range and with the 51%/41% split, that puts the actual range at 39% - 53%. To give you an idea of how close it is, if the split were 53%/39% or if, with the 51%/49% split, but the vote count were 400, Obama would be statistically in the lead in Hubland.
8/21/12: Today, President Obama broke into a statistical lead again ... barely. The 247th vote gave him the margin he needed. But, who knows, the 248th vote may make it a tie again.
9/14/2012: There are 403 votes at the moment with Obama having 53% of them and Romney 40%; the margin of error is 9% giving President Obama a solid lead. In fact, his lead has been growing steadily since the last report.
9/24/2012: With 454 votes, which is approaching a normal survey's sample size, if not its randomness, Obama is not pulling ahead, just as he is nationally. With 54%/39%, we end up with an 8.8% margin of error, giving Obama a bit of padding, at least for Hubland voters. This Obama bias is even more pronounced given the Conservative tilt of this Hub's readership; meaning the large Moderate population is probably swinging heavily to Obama. The question, of course, is whether this trend being exhibited in the Hub microcosm will be seen in the national vote.
10/20/2012: With 561 responses, this poll has moved up to the bottom of the "big boy" list for polling; the margin of error is now about 7.5%. The one thing missing, of course, is a viable random selection process, which I have discussed earlier. But, once you understand the population these responses are drawn from, you can come to some sense of how people actually feel.
Consider the three Demographic Surveys that accompany this hub. The readers of this hub, and presumably voting, are 1) split 50/50 male and female, 2) split 40/40 moderate and conservative, the remainder identifying themselves as progressive, 3) of the male voters, they are weighted to the moderate spectrum while 4) females are weighted to the conservative side. Also, one might believe that those who voted here are equivalent to Likely Voters; why else would they be on hub pages, reading this kind of hub, and voting in this poll?
With that understanding, and a solid 56%/37% advantage for President Obama in this poll, I would think that there is a clear indication that moderates who will vote are definitely swinging toward Obama.
As an aside, the recent polling indicates that the Democrats will keep the Senate 53/47 (with the two independents siding with Democrats) and a chance (poor) to pick up two seats, NV and AZ.
10/27/2012: The debates are over and there are about 10 days left before we know who the next President will be to preside over a "do-nothing" Congress, given the way those polls are looking. Isn't that depressing? Two more years of bickering and squabbling between a "I will not compromise until catastrophe strikes" conservative majority-minority and, if Romney wins, a Democratic Party looking for revenge for all of the injustice they feel the conservatives heaped upon them the previous two years. In this Hub's poll, Obama did not suffer the downturn that he saw in the national polls after his sad performance in the first debate; in fact, he gained one more point. Consequently, if only those kinds of people who have the same demographics of those who read this hub were to vote, Obama would win hands down; but, they're not and nationally it is a toss-up. On the other hand, a State-by-State break down shows Obama the likely winner; closer than it was prior to the first debate, but the winner nevertheless.
11/15/2012: The result was Obama 50.6% (332) and Romney 47.8% (206).
DEMOGRAPHIC SURVEY #3
In Trying to Determine the Political Distribution of Hub Readers: If Your Are -
ONE MORE DEMOGRAPHIC
From the above information, I can also derive the following:
- Female Distribution: Conservative: 44%, Moderate: 33%, Progressive: 22%
- Male Distribution: Conservative: 31%, Moderate: 40%, Progressive: 29%
8/30/2012: The above distribution, with 38 responses, raised my eyebrows a bit when the Male distribution was posted as 29%/33%/38% vs. the females 35%/43%/22%, if anything, my bias would have arranged it in the opposite order, go figure.
9/7/2012: With 81 responses, my eyebrows returned to normal with the males distribution being 33%/37%/30% and the females 31%/46%/23%.
10/19/2012: My respondants have more than doubled to 176 producing a distribution of 31%/40%/29% for males and a surprising 44%/33%/22% for females. The latter result is doing a number on my stereotype of where I thought women stood in the political spectrum, it is reverse of my internal perception; can some of you shed some light with your comments?
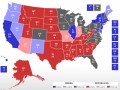
THE ELECTORAL MAP
STATE
| ELECTORAL VOTES
| OBAMA WON
| SOFT OBAMA
| SOFT ROMNEY
| ROMNEY WON
| LATEST POLL
|
|---|---|---|---|---|---|---|
TOTAL
| 538
| 303
| 206
| |||
AK
| 3
| 3*
| ||||
AL
| 9
| 9*
| ||||
AR
| 6
| 6*
| ROMNEY +21
| |||
AZ
| 11
| 11*
| ROMNEY +7
| |||
CA
| 55
| 55*
| OBAMA +15
| |||
CO
| 9
| 9*
| OBAMA +1
| |||
CT
| 7
| 7*
| OBAMA +12
| |||
DC
| 3
| 3*
| ||||
FL
| 29
| ROMNEY +1
| ||||
GA
| 16
| 16*
| ROMNEY +8
| |||
DE
| 3
| 3*
| ||||
HI
| 4
| 4*
| OBAMA +27
| |||
IA
| 6
| 6*
| OBAMA +3
| |||
ID
| 4
| 4*
| ||||
IL
| 20
| 20*
| OBAMA +17
| |||
IN
| 11
| 11*
| ROMNEY +9
| |||
KS
| 6
| 6*
| ||||
KY
| 8
| 8*
| ||||
LA
| 8
| 8*
| ||||
MA
| 11
| 11*
| OBAMA +15
| |||
MD
| 10
| 10*
| OBAMA +18
| |||
ME
| 4
| 4*
| OBAMA +13
| |||
MI
| 16
| 16*
| OBAMA +5
| |||
MN
| 10
| 10*
| OBAMA +8
| |||
MO
| 10
| 10*
| ROMNEY +11
| |||
MS
| 6
| 6*
| ||||
MT
| 3
| 3*
| ROMNEY +10
| |||
NC
| 15
| 15*
| ROMNEY +4
| |||
ND
| 3
| 3*
| ROMNEY +20
| |||
NE
| 5
| 5*
| ROMNEY +13
| |||
NH
| 4
| 4*
| OBAMA +3
| |||
NJ
| 14
| 14*
| OBAMA +14
| |||
NM
| 5
| 5*
| OBAMA +10
| |||
NV
| 6
| 6*
| OBAMA +3
| |||
NY
| 29
| 29*
| OBAMA +26
| |||
OH
| 18
| 18*
| OBAMA +3
| |||
OK
| 7
| 7*
| OBAMA +32
| |||
OR
| 7
| 7*
| OBAMA +7
| |||
PA
| 20
| 20
| OBAMA +4
| |||
RI
| 4
| 4
| OBAMA +24
| |||
SC
| 9
| 9*
| ||||
SD
| 3
| 3*
| ||||
TN
| 11
| 11*
| ||||
TX
| 38
| 38*
| ROMNEY +15
| |||
UT
| 6
| 6*
| ROMNEY +42
| |||
VA
| 13
| 13*
| OBAMA +2
| |||
VT
| 3
| 3*
| ||||
WA
| 12
| 12*
| OBAMA +12
| |||
WI
| 10
| 10*
| OBAMA +4
| |||
WV
| 5
| 5*
| ||||
WY
| 3
| 3*
| ||||
TOTALS
| 538
| REPUBLICANS - 229
|
ELECTORAL VOTES WITH A * ARE PROJECTED TO WIN, THE REST ARE MY ESTIMATES BASED ON POLLS SHOWING ALMOST CERTAIN WINS
WHAT DO THE POLLS SHOW
THE FOLLOWING SERIES OF TABLES will show a running view of how the candidates are fairing against each other from various perspectives. Where I can, I use the last three latest polls and then recompute the percentages, weighted by the number of people polled in each poll. This is different from say the CNN Poll of Polls and the RealClearPolitics averages which simply average the results together without the weighting.
It shouldn't be a surprise to you, but it makes a difference of who is taking the poll. I have found pollsters such as Rasmussen clearly favor the Conservative side while ones like ones like the Public Policy polls have a much more Liberal bias to them.
NATIONAL POLL OF OBAMA vs ROMNEY
CANDIDATE
| 11/3/2012
| 10/20/2012
| 10/14/2012
| 9/20/2012
| 9/12/2012
| 9/10/12
| 8/14/12
| 7/31/2012
| 7/12/2012
| 6/25/2012
| 5/19/12 - 6/19/12
| 5/2 - 5/20/12
| 4/28 - 5/15/12
| 4/28 - 5/11/2012
| 4/12 - 5/3/2012
| 4/5 - 4/27/2012
| 4/5 - 4/22/2012
| 3/25 - 4/15/2012
| 3/20 - 4/12/2012
| 3/25 - 4/9/2012
| |
|---|---|---|---|---|---|---|---|---|---|---|---|---|---|---|---|---|---|---|---|---|---|
BARACH OBAMA
| 48%
| 47%
| 47%
| 48%
| 49%
| 48%
| 47%
| 46%
| 47%
| 46%
| 50%
| 46%
| 47%
| 46%
| 46%
| 48%
| 47%
| 46%
| 48%
| 48%
| |
MITT ROMNEY
| 47%
| 47%
| 47%
| 45%
| 45%
| 46%
| 45%
| 46%
| 44%
| 46%
| 45&
| 45%
| 44%
| 45%
| 43%
| 44%
| 44%
| 44%
| 47%
| 43%
| |
Not Sure/Undecised
| 5%
| 6%
| 6%
| 7%
| 6%
| 6%
| 8%
| 8%
| 9%
| 8%
| 5%
| 9%
| 9%
| 9%
| 11%
| 8%
| 9%
| 10%
| 5%
| 9%
|
ESTIMATED ELECTORAL COUNT (needed to win - 270)
CANDIDATE
| 11/4/2012
| 11/1/2012
| 10/26/2012
| 10/17/012
| 10/4/2012
| 9/23/2012
| 9/12/2012
| 8/31/2012
| 8/24/12
| 8/21/2012
| 7/10/2012
| 6/27/2012
| 6/26/2012
| 6/21/2012
| 6/13/2012
| |
|---|---|---|---|---|---|---|---|---|---|---|---|---|---|---|---|---|
PRESIDENT OBAMA
| 303 (56%)
| 290 (54%)
| 286 (53%)
| 328 (61%)
| 347 (64%)
| 314 (58%)
| 301 (56%)
| 332 (62%)
| 332 (62%)
| 332 (62%)
| 332 (62%)
| 319 (59%)
| 330 (61%)
| 343 (64%)
| 314 (58%)
| |
GOVERNOR ROMNEY
| 235 (44%)
| 248 (46%)
| 252 (47%)
| 210 (39%)
| 191 (36%)
| 224 (42%)
| 237 (44%)
| 206 (38%)
| 206 (38%)
| 206 (38%)
| 206 (38%)
| 219 (41%)
| 208 (39%)
| 195 (36%)
| 224 (42%)
| |
Assume a 2% Margin of Error
| ||||||||||||||||
PRESIDENT OBAMA
| 281 (52%)
| 277 (52%)
| 259 (48%)
| 277 (51%)
| 288 (54%)
| 280 (52%)
| 264 (49%)
| 277 (51%)
| 309 (57%)
| 293 (54%)
| ||||||
GOVERNOR ROMNEY
| 206 (39%)
| 206 (39%)
| 191 (36%)
| 206 (38%)
| 191 (36%)
| 191 (36%)
| 204 (40%)
| 191 (36%)
| 191 (36%)
| 191 (36%)
| ||||||
Assume a 3% Margin of Error
| ||||||||||||||||
PRESIDENT OBAMA
| 247 (46%)
| 247 (46%)
| 247 (46%)
| 253 (47%)
| 271 (50.3%)
| 276 (51%)
| 232 (43%)
| 250 (46%)
| 266 (49%)
| 266 (49%)
| ||||||
GOVERNOR ROMNEY
| 196 (36%)
| 196 (36%)
| 181 (34%)
| 196 (36%)
| 181 (34%)
| 191 (36%)
| 191 (36%)
| 191 (36%)
| 191 (36%)
| 191 (36%)
|
NOTES ON THE ESTIMATED ELECTORAL COUNT
THE INFORMATION FOR THIS TABLE is from that really long chart above. And, now that is about three months away, I thought I might add some detail and insight, if that is what you call a layman's view, about what I see. First some statistics:
President Obama's lead in the electoral count, despite the neck-and-neck national poll numbers has been solid without a lot of erosion, meaning not very many "solid" states have become "soft" states and virtually no "soft" states have migrated over to the other side ... yet.
- At the moment, Obama has 17 states, totaling 201 electoral votes solidly in his corner, that is 75% of the total 270 votes he needs to continue his Presidency.
- - The states I include in this "solid" category are ones where he currently beats Romney by more than 7%, in a weighted average, with Likely Voters give a double weight, in the polls; either that or it is a slam dunk, like Washington D.C. - in addition, these states are: CA, CT, DE, HI, IL, MA, MD, ME, MN, NJ, NM, NY, OR, RI, VT, and WA. Only OR is barely "solid", judging from the polling data, the rest are "Rock Solid" based on the polls or through common sense.
- - Obama has "soft" leads in 10 states, CO, FL, IA, MI, NH, NV, OH, PA, VA, WI, which account for another 131 or 48% of the electoral votes needed to win.
- - That means, for the moment, President Obama has 334 or 123% of the votes needed to win, a 23% or 64 vote cushion, in other words.
- - You can dig a little deeper into those numbers (isn't this fun? :-), don't you see why I made a career of it?). First, let's consider how "hard" or how "soft" those "soft" votes are?
- -- It turns out 58 (21%) votes varen't very soft at all; they are NH, NV, OH, PA, WI.
- -- Two of the states, FL and VA, keep fiip-flopping between Romney and Obama as each poll comes out, they are worth 42 (16%) of the votes needed to win.
- - A second way is to look where Obama has been gaining or losing strength. (Under Construction)
- On the other hand, Romney has a "Hard" lead in 18 states, one more than President Obama, but, unfortunately for Governor Romney, they count for only 140 or 52% of the electoral votes needed to win. These states are, AK, AL, AR, GA, ID, IN, KS, LA, KY, MS, MT, ND, NE, OK, SC, SD, TX, UV, WV, and WY.
- - The soft states for Romney are KY, MO, NC, TN; and I suspect KY, MO, and TN are very soft at all.
- There is another nuance that needs to be watched, because it can affect many things including the crucial issue of voter turnout and that is why people are voting.
- - For the Democrats, by and large, they like their candidate and their Party's platform; further, they really dislike conservatism. Additionally, while there are some disagreements, Obama and most of the Party are in sync with the Party's platform
- - For Conservatives, by and large, they dislike their candidate but like their Party's platform; further, they really dislike moderates and progressives. However, and I think everyone knows this, Romney, despite all of his rhetoric, is not in sync with the social aspects of the Conservative platform, but had to suppress his core Mormon principles in order to become the conservative nominee.
- - Those differences may be telling in the voting booth.
- So, on 8/4/2012, where does that leave us? Assuming my way of looking at things is correct, and who knows, they may be, then if all three "up-in-the-air" states, FL, NC, and VA go for Mitt Romney; President Obama still wins with 292 electoral votes, 22 more than needed.
- - No state that may go Romney's way, which is currently in Obama's pocket, has 22 or more electoral votes, so, that means for Romney to become President he MUST win FL, NC, VA, AND two or more other states with a combined electoral count of 22.
- - That, my friends, is a tall order, wouldn't you say?
8/21/2012: I added two more sets of rows of information. The middle set is what the counts look like if I take out the "too close to call" states where the difference between candidates is 2% or less. The bottom set is the same thing but assuming a 3% margin of error. I use those figures because the number of people in the surveys I am using when I recalculate the differences has a margin of error between those two limits.
As you can see, Obama and Romney haven't swapped states for almost two months now, but there has been changes in level of support in the various states. These new rows should help show that trending, if there is any; which is inferesting in and of itself.
DIRECTION OF THE COUNTRY
HOW PEOPLE FEEL about the direction of the country probably has more to do with the incumbent losing votes rather than the challenger getting votes. Now, that may sound like a bit of double-speak, it isn't. For example, if a voter is otherwise undecided about one candidate or the other, the normal inclination is to stick with what is known, i.e., the incumbent. Therefore, if the voter feels the country is doing OK or getting better, the incumbent gets the vote. It is only when the voter believes aren't going so well under the incumbent are they likely to vote for the other guy or gal; the challenger is simply the beneficiary of a disgruntled voter.
To derive any meaning from the direction of the country data, one needs a long-term perspective in order to see how things are changing and who may or may not get benefit from the change. That is why I included a few historical numbers on the table below. You might be surprised by what they show for it is easy to forget what it "use to be like" under the less than stellar years of the Bush administration.
RIGHT TRACK/WRONG DIRECTION
DIRECTION
| 12/10/12
| 11/3/2012
| 10/29/2012
| 10/20/2012
| 10/14/2012
| 9/30/2012
| 9/17/2012
| 9/12/2012
| 9/2/2012
| 8/6/2012
| 7/22/2012
| 7/1/2012
| 6/24/2012
| 6/11/2012
| 5/14/2012
| 5/7/2012
| 5/1/2012
| 4/17/2012
| 4/8/2012
| 9/27/2011
| 6/1/2009
| 1/26/2009 (BUSH)
| 10/12/2008 (BUSH)
|
|---|---|---|---|---|---|---|---|---|---|---|---|---|---|---|---|---|---|---|---|---|---|---|---|
RIGHT TRACK
| 40%
| 41%
| 41%
| 40%
| 39%
| 37%
| 34%
| 32%
| 29%
| 29%
| 29%
| 28%
| 30%
| 29%
| 30%
| 31%
| 30%
| 31%
| 34%
| 17%
| 40%
| 27%
| 12%
|
WRONG DIRECTION
| 51%
| 53%
| 54%
| 54%
| 55%
| 56%
| 58%
| 59%
| 63%
| 62%
| 61%
| 61%
| 60%
| 60%
| 59%
| 60%
| 60%
| 60%
| 61%
| 75%
| 50%
| 64%
| 82$
|
Not Sure
| 9%
| 6%
| 5%
| 6%
| 6%
| 7%
| 8%
| 9%
| 8%
| 9%
| 10%
| 11%
| 10%
| 11%
| 11%
| 9%
| 10%
| 9%
| 5%
| 8%
| 10%
| 9%
| 6%
|
GENERAL SATISFACTION WITH THE WAY THINGS ARE GOING
ANOTHER MEASURE OF HOW THE WAY AMERICA IS FEELING is the Satisfaction rating This is different from the Right Direction - Wrong Direction measure because it is measuring how happy people are in spite where they think the country is going. That, potentially, could mean more in the voting booth than whether they think the country is heading in the wrong direction, because their conviction on that point may not be very strong.
7/27/2012: In comparing the Right Track-Wrong Direction Survey with the one on Satisfaction, it is becoming clear that people may be becoming more accepting of the way things are even though they don't think the way things are, are the way things should be. In fact, American's haven't wavered at all in thinking this country is on the wrong track, meaning, to me at least, they don't like the way government is treating its citizens, the slow economic recovery that results from government dysfunction, and a host of structural ills. Having said that, our Satisfaction level is increasing while, at the same time, our Dissatisfaction level is declining; both good signs for President Obama.
US SATISFACTION
SATISIFACTION LEVEL
| 11/18/2012
| 10/30/2012
| 9/30/2012
| 8/5/2012
| 7/17/2012
| 7/9/2012
| 6/17/2012
| 6/3/2012
| 1/16/2012
| 7/24/2011
| 5/16/2009
| 9/18/2012
|
|---|---|---|---|---|---|---|---|---|---|---|---|---|
SATISFIED
| 36%
| 35%
| 33%
| 30%
| 29%
| 28%
| 26%
| 25%
| 24%
| 22%
| 33%
| 9%
|
DISSATISFIED
| 60%
| 61%
| 64%
| 66%
| 67%
| 68%
| 69%
| 70%
| 74%
| 76%
| 64%
| 88%
|
PRESIDENT OBAMA JOB APPROVAL
AFTER BEING IN THE TANK for so long, President Obama's job approval rating, as opposed to his personal approval rating which has always been good, has finally gotten to ... even; a statisical tie. How it goes from here has everything this to do with the price of gas and the economy.
OBAMA JOB APPROVAL
JOB APPROVAL
| 12/13/2012
| 10/20/2012
| 10/15/2012
| 9/11/2012
| 8/19/2012
| 7/2/2012
| 6/21/2012
| 5/28/2012
| 5/9/2012
| 4/4 - 4/20/2012
| 3/24 - 4/15/2012
| 3/20 - 4/10/2012
| |
|---|---|---|---|---|---|---|---|---|---|---|---|---|---|
OBAMA JOB APPROVAL
| 52%
| 49%
| 50% !!
| 47%
| 46%
| 46%
| 47%
| 47%
| 47%
| 48%
| 46%
| 48.4%
| |
OBAMA JOB DISAPPROVAL
| 44%
| 48%
| 47%
| 49%
| 50%
| 49%
| 49%
| 48%
| 49%
| 47%
| 48%
| 46.6%
| |
Not Sure
| 4%
| 3%
| 3%
| 4%
| 4%
| 5%
| 4%
| 5%
| 4%
| 5%
| 6%
| 5%
|
FAVORABILITY RATINGS
THIS IS AN IMPORTANT SET OF LONG-TERM indicators as they are slow to change and will, in all probability tip the balance to the better perceived candidate among independent voters if they enter the ballot box undecided. Not shown on these tables is the history of these rating, so to put them into context let me note that:
- In January 2008, Barach Obama's ratings were 53% favorable to 40% unfavorable
- They blew up in December 2008, to 71% - 18%, favorable-unfavorable
- At the time he became President, Obama's ratings were 69% F and 21% U.
- By October 2010, the numbers had shrunk to 49% F and 44% U.
- Obama's low point was in August 2011, when his ratings were tied at 47%
- On the other hand, in April 2009, Mitt Romney's favorable/unfavorable rating was 39%, 33%, respectively
- By December 2009, that had dropped to 34% favorable and 33% unfavorable
- It stayed even until November 2011, when it permanently reversed to 35% favorable and 38% unfavorable, and has gotten worse since.
With that as a background, you can begin making meaningful statements regarding the current trends. As of 5/14/2012, you don't see any trend change for President Obama, basically both the favorability and unfavorability ratings are flat. That is not true for Mitt Romney. Both of his numbers are trending up; the problem for Romney though is the unfavorable ratings seem to be increasing faster than his favorable ratings, not a good trend.
FAVORABILITY RATINGS
FAVORABILITY RATING
| 12/10/2012
| 10/30/2012
| 10/28/2012
| 10/21/2012
| 10/15/2012
| 10/2/2012
| 9/23/2012
| 9/10/12
| 9/2/2012
| 8/29/2012
| 8/19/2012
| 8/6/1012
| 7/30/2012
| 7/23/2012
| 7/9/2012
| 7/1/2012
| 6/24/2012
| 6/11/2012
| 5/20/2012
| 5/14/2012
| 5/7/2012
| 5/1/2012
| |
|---|---|---|---|---|---|---|---|---|---|---|---|---|---|---|---|---|---|---|---|---|---|---|---|
OBAMA FAVORABLE
| 53%
| 49%
| 49%
| 49%
| 50%
| 52%
| 52%
| 51%
| 49%
| 49%
| 48%
| 48%
| 48%
| 48%
| 48%
| 49%
| 49%
| 49%
| 49%
| 49%
| 49%
| 49%
| |
OBAMA UNFAVORABLE
| 42%
| 47%
| 47%
| 47%
| 47%
| 45%
| 43%
| 45%
| 46%
| 45%
| 45%
| 46%
| 46%
| 46%
| 46%
| 45%
| 44%
| 45%
| 45%
| 45%
| 45%
| 45%
| |
ROMNEY FAVORABLE
| 47%
| 48%
| 48%
| 50% !!
| 44%
| 42%
| 45%
| 43%
| 41%
| 41%
| 39%
| 40%
| 40%
| 40%
| 41%
| 38%
| 40%
| 40%
| 40%
| 39%
| 39%
| ||
ROMNEY UNFAVORABLE
| 47%
| 45%
| 44%
| 44%
| 49%
| 48%
| 49%
| 48%
| 48%
| 48%
| 49%
| 47%
| 45%
| 46%
| 46%
| 45%
| 45%
| 46%
| 46%
| 46%
| 46%
|
PARTY IDENTIFICATION
THIS NEXT CHART is from the Huffington Post and is not that common but very important, nevertheless, and is the track of party identification. It is almost axiomatic today that if you are a registared Republican, you will either not vote or vote for Romney, unless there is a Conservative third party candidate out there. Likewise, if you are registared Democrat, it is pretty certain, but not guaranteed, that you will vote for Obama, not vote, or, which cost Al Gore the presidency, vote for a liberal third party candidate. What is left, obviously, are those who consider themselves Independents.
Independents, as you would expect, come in three varieties, Left-leaning, Right-leaning, and true Moderates who don't like either party; that is me in the last one. As has been said by many a Pundit, so goes the Independents, goes the election. It has been "common knowledge" that Independents outnumber either Democrats or Republicans. So, guess my surprise when my research turned up the results below. If that trend holds, it spells trouble for Republicans.
UPDATE: 4/22/2012 - What you can't see from these numbers ... yet ..., but can from the chart I take them from on HuffingtonPost.com, is that Party Identification appears to be on the move. Both Democratic AND Republicans are picking up supporters while Independents are losing ground. Right now, the movement is in the first decimal place, but the trend is clear at the moment. This time two years ago, the same thing was happening, but to a much smaller degree, while in 2008, both Independents and Republicans were losing identification to the Democrats (if I extrapolate from the September 2008 figure I see).
UPDATE: 5/8/2012 - The trends in Party Identification has produced a shift; no longer are the Republicans in last place, but has just slipped by Independents. People are beginning to choose sides at a faster clip now, choosing to identify with one of the major parties rather than keep their options open. It appears Democrats and Republicans are picking up members at about the same rate, maybe the Democrats marginally faster. What is clear, as has happened in other elections, just not to this degree, those who believe they are still Independent, is shrinking.
UPDATE: 5/28/2012 - I have been snookered by Huffingtonpost! They have been posting an incorrect report since I started this hub, and all that I have written above is pure bunk :-(. Clearly, I wouldn't have been surprised by what used to be a large decline in independent voters in favor of Democrats, if I had found the correct chart (I corroborated this one with some Gallup results). Obviously, what is thought to be true about independents is, they make up the largest voting block. What you can't see in the numbers yet, are very slight, but nevertheless steady declines in both Independent and Republican percentages and a just as imperceptible increase in voters identifying with the Democrats.
UPDATE: 6/21/2012 - This poll, the Party Identification Poll, does not bode well for Conservatives. For a poll that moves in terms of tenths of percents over time, glacial speed, we are seeing a heat wave. Republicans are shedding voters who identify with them and most, if not all, are ending up as Independents. A few Independents seem to be migrating to the Democrats since they are gaining strength as well, but very slowly. Now, this migration from Republican to Independent doesn't mean the Republicans are going to lose votes at the polls, but it certainly doesn't mean you are going to keep them either. It would seem to me, the further right a candidate is, the less likely it is they will receive these newly minted independent voters.
UPD
PARTY IDENTIFICATION
PARTY
| 10/15/2012
| 9/24/2012
| 9/17/2012
| 9/10/2012
| 8/20/2012
| 7/26/2012
| 7/9/2012
| 6/20/2012
| 5/28/2012
| 4/17/2012
| 4/8/2012
| 11/5/2011
| 10/3/2010
| 8/3/2009
| 1/18/2009
|
|---|---|---|---|---|---|---|---|---|---|---|---|---|---|---|---|
DEMOCRATIC
| 32%
| 33%
| 33%
| 33%
| 33%
| 33%
| 32%
| 33%
| 32%
| 32%
| 31%
| 31%
| 33%
| 35%
| 38%
|
INDEPENDENT
| 37%
| 38%
| 34%
| 35%
| 34%
| 38%
| 38%
| 37%
| 39%
| 38%
| 38%
| 39%
| 34%
| 36%
| 34%
|
REPUBLICAN
| 23%
| 23%
| 24%
| 24%
| 24%
| 23%
| 24%
| 25%
| 24%
| 25%
| 25%
| 25%
| 26%
| 24%
| 26%
|
UNDECIDED/OTHER
| 8%
| 6%
| 9%
| 8%
| 9%
| 6%
| 6%
| 5%
| 5%
| 5%
| 5%
| 5%
| 7%
| 5%
| 2%
|
DEMOGRAPHIC POLLS
I hope you participate in the next two little polls. I am trying to get an understanding of the readership of the hubs I write which, in turn, will hopefully allow me to make better since of some the other polling questions I ask. It is fun being a wonk.
DEMOGRAPHIC POLL #1
Do you consider yourself most closely aligned with the -
DEMOGRAPHIC POLL #2
Are you -
Related Links
- Why would a Moderate Want to Vote for Mitt Romney an...
The 2012 elections are quickly approaching and the campaign rhetoric is getting white hot. Moderates/independents will decide what happens to the country, whether it moves Right, like it did in 2010, or Left, as in 2008, or remain in gridlock as it i - Romney Says, "Obama's Plan Failed!"; He Forgot to Sa...
Would you believe me if I told you that Mitt Romney admitted that it is the Conservatives that are responsible for the economies poor performance and not President Obama? Well, I am and it is a very logical explanation. Care to see how? Read on. - Has President Obama Made Things Better or Worse in t...
One of the Conservatives major themes is that Americans are not better off today than they were four years ago. Here is a list of things that have changed since Obama took office. - The Senate Conservatives Killed President Obama's Jo...
There are two competing plans for Job creation in America on the table today; the Obama Jobs Bill, which the Conservatives voted down last week, and the Conservatives - On Principle and Pragmatism VIII - Understanding the...
How Americans think about why the Constitution was written drives which political party and candidate they ultimately vote for, or even if they vote at all. This set of polls is to help determine what those views are, by political philosophy so that - On Principle and Pragmatism II - Ratification of the...
Most Americans, including most Conservatives and Tea Party types, as well as Democrats, are not aware how close we came to not having an America at all. Roughly 50% of colonialists wanted something more like the what the European Union is today, exce - On Principle and Pragmatism I - U.S. Constitutional ...
The Constitutional Convention, probably the most important gathering of men in the history of the United States and the second most important gathering in the history of the united States. It started out simply as an exercise to strengthen the Articl
AMAZON ON CAMPAIGN 2012

© 2012 Scott Belford
Related

Independents and Conservatives With a Conscience: Answer Me This Please.

2012 Guide to Swing States

Scary Things Lead to Spooky Places; It's Tricks, Not Treats, When It Comes to Today's Democratic Party

The Facts About Election Fraud
American Politics: Another Poll Being MisReported, MisUsed, and Abused - The Iran Nuclear Deal

![American Politics: The BIG LIE in Politics, From The Republican Presidential Convention [124]](https://images.saymedia-content.com/.image/t_share/MTc2NDYyMjI1MzEyNjU1MzIy/the-big-lie-in-politics-from-the-conservative-side.jpg "American Politics: The BIG LIE in Politics, From The Republican Presidential Convention [124]")

