Violent Crime in the US

All data was taken from the FBI UCR (uniform crime reports) which is derived from over 18,000 city, university/college, county, state, tribal, and federal law enforcement agencies voluntarily participating in the program. From their some stats were created, including ten year averages (mean), and crime as a percent of the population. The numbers were broken up into decades, 1960-1969, 1970-1979 and 1980-1989 through the year 2009.
From 1960 to 1969 the population of the United States grew from 179,323,175 to 201,385,000, a growth rate of almost 11%, the total number of violent crimes in 1960 vs. 1969 increased by 55%. Even though the decade was reasonably prosperous the 1960’s also saw its share of trouble including the civil rights movement and the radical 60's activist groups.
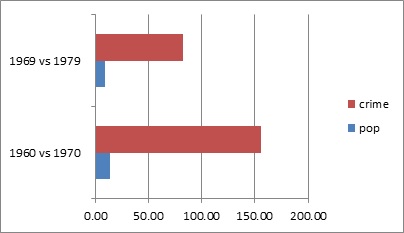
During the 1970’s population growth slowed by about 3% and the total number of violent crimes by almost 18%. This is based on the crime rate of 1979 compared to 1970 just as the rate for the 60’s was 1969 against 1960. While this appears to show a lower crime rate the population numbers skew the results. When you compare 1960 to 1970 the difference in population is 13% higher in 1970 but the total number of violent crimes was a staggering 156% higher. The same comparison for 1969 vs. 1979 yields a 9% in population growth with an 82% growth in violent crimes.
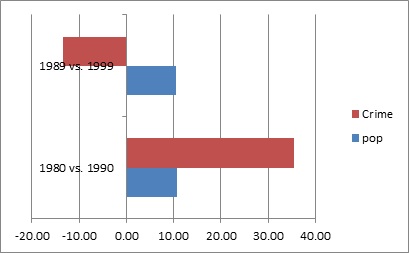
The trend continued in a similar fashion in the 1980’s where 1980 and 1989 saw close gains in population at 10% and 12% respectively and the crime rate increased 81% in 1980 and 36% in 1989. The trends become more evident when the violent crime rate totals are compared to the population which shows an increasing level through the three decades already covered.
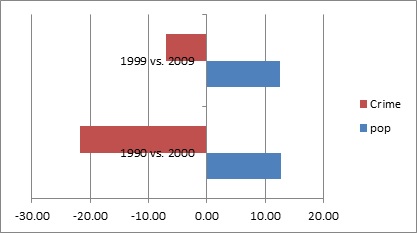
The crime rate compared to the total population in the 1960’s ranged from 16% in 1960 to 32% in 1969. In the 70’s the lowest percentage of crime vs. population was in 1970 at 36% with a high of 59% in 1979. In the 80’s the lowest percentage was 53% in 1983 and 1984 returning to a high of 66% in 1989. The highest level is found in 1991 and 1992, both at 75%. After 1992 the trend changes as the rate of crime as a percent of population starts to drop from 71% in 1994 to 52% in 1999, a decrease of almost 20%. During this time frame the lowering trend also appears when comparing 1989 vs. 1999 where the normal 10% increase in population was accompanied with a 13% decrease in crime, the first decrease noted. This trend held for the new millennium.
In 1994 with the help of 200 million dollars in federal grant money, President Clinton announced the 100,000 cops grant program aimed at placing more officers on the streets. In the 90’s the average rate of violent crime vs. population was 67% and dropped to 47% for the decade of 2000 to 2009.
Once the grant programs took hold there were several intended and unintended consequences. The increase in police presence greatly reduced the crime rate because the grants not only added officers on the street but also allowed agencies to receive large grants for specialized units such as traffic units and specialized community policing units.
Another unintended consequence of the grant programs is under reporting or outright falsification of numbers. This occurs at a much higher rate than people realize with chiefs and sheriffs pressured for results which will garner them more grants. Many grants are results based, first using pre-grant results to determine the amount of money an agency receives to post grant numbers in order to determine whether or not they receive more money or lose their grants outright.
As an example, crimes are often lowered or changed at the reporting stage such as vandalism instead of auto breaking and entering or simple assault instead of a felony assault or sexual assault. Because agencies seek specialized grants which are stat based some may succumb to the pressure and alter their results. Once an agency receives a grant the numbers used to receive the grant must go down. If the granting agency sees the grant as being misused they can stop the funding and in some cases confiscate the equipment gained by grant money.
A stipulation to many grants is the agency must show it will get the funds to continue the employment and or program instituted by the grant. Most grants will offer money for a certain number of years with the promise that the agency will continue the employment or program created by the grant after the time period runs out.
Since 2008, as a result of the housing crisis, financial crisis and monstrous government debt many states, cities and municipalities are in the red. Combine this with less federal grant money and the inability to maintain the workforce created by grant money and many agencies have to cut back its workforce or furlough officers. While the population grows officer presence remains stagnate or is decreasing. This may create an environment for the violent crime rate to return to pre-1994 numbers.
As of 2010 the rate of violent crime compared against the population is hovering around 43%. Once the numbers start to appear for 2011 and beyond it may become easier to see if there is an increase on the horizon. Things of this nature tend to be cyclical. While we have never reached the lows of the early 60’s, crime did reduce when compared to the population from 1994 to present. One has to wonder, since the recession began and remains stagnant will the reduction in officer workforce compared to population growth cause an increase in violent crime?
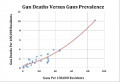
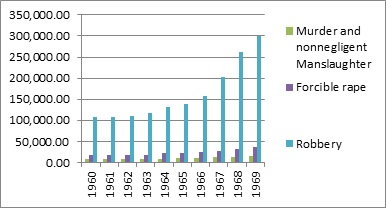
Below are several charts showing a graphic view of results mentioned in this hub.
")