A Repeating Pattern to UFO Crashes


In the Midst of a UFO Crash Cycle Peak
Are you ready for a little excitement? Well, we are presently within a period of time when UFO crashes have a greater chance of happening. Back in 1997 I wrote an article related to a periodic cycle of time that peaked when UFO crashes occurred. You may think that that is crazy because there could only be a few such crashes, but that isn't really the case. I dug deep into the subject back then, exploring books by Kevin Randle, Jenny Randles and Leonard Stringfield (among others) to come up with 50 such events from the years 1948 to the middle of 1989. Now you might also think, what about 1947? How about Roswell? Well Roswell has been researched so much that it has pushed other crash reports out of the picture.
Also, in the year 1947 many other suspicious or hoaxed reports surfaced that I believe were concocted to muddy the waters related to UFO crashes at that time. Since I determined that 13 of my proposed cycles fit evenly into 41.5 years and there had to be a starting and ending point to the study anyway, I chose to start it in 1948 and end it in the middle of 1989 (even though that also meant not including 8 reports before and after that period that would have occurred during peaks of the 3.19 year cycle). Restricting the period of study to 41.5 years also turned out to leave an even number of reports to study, with 25 inside the 1/4 cycle peak period and 25 non-crash reports outside of that range. This meant that the cycle crashes occurred within the cycle peak twice what would be expected from chance. Some of you may think that to have results come out so clear cut seems like I massaged the data, but I assure you that there was no conscious attempt to manipulate the data to achieve this nearly ideal result. I will mention the screening process used to choose the crash reports for the study later in this hub.
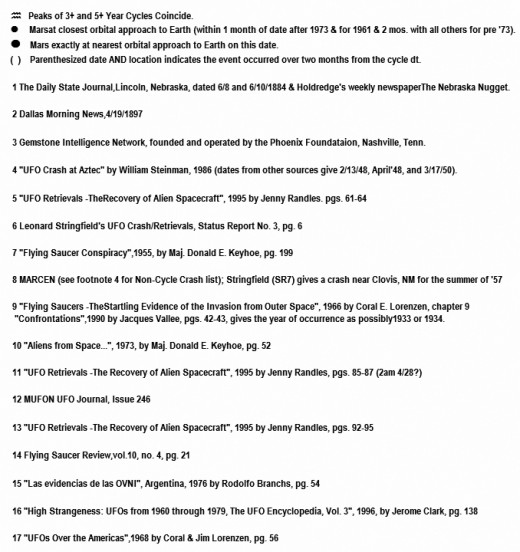
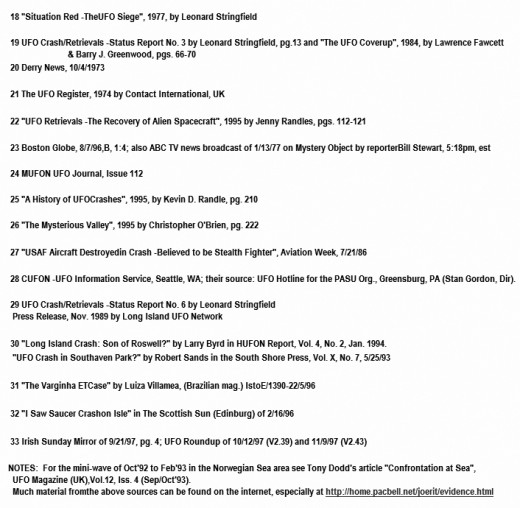
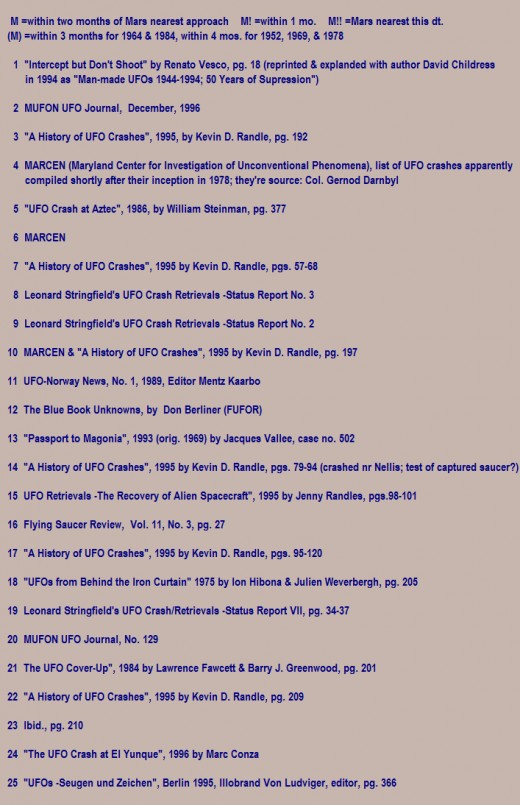
Crash and Wave Chart Symbol Index and References
I had originally thought that if an event occurred during the 1/4 cycle peak period that it was almost surely the real deal, but I now believe that there is randomness to contend with as well. What that means is that I am sure there are random real events outside of that peak period (say the Roswell case) just as there are hoaxed events inside that significant peak period. It is also my belief however that there is a much higher percentage of true events inside that peak period than outside.
Many readers will probably feel that there shouldn't be a periodicity for UFO crashes since they ought to happen due to malfunctions which would likely be a random occurrence. However, my theory is that there are periodic gravitational fluctuations or anomalies that vary in a predictable way. During such times, alien spacecraft technology could become more vulnerable to malfunction and accidents would then be more likely to occur. Another possibility is that their could be breakdowns or imbalances in window areas at such times that would affect the ability to transition smoothly between their dimension of reality and ours. Or their ability to cloak themselves might become diminished and leave them more vulnerable to attack by our military forces. The proposed 3.19 year cycle would likely be only one contributing factor to such crash reports. Another may be solar activity and also at least one short period cycle measured in days that I will discuss later in this hub.
Crash and Wave Chart Symbol Index and References
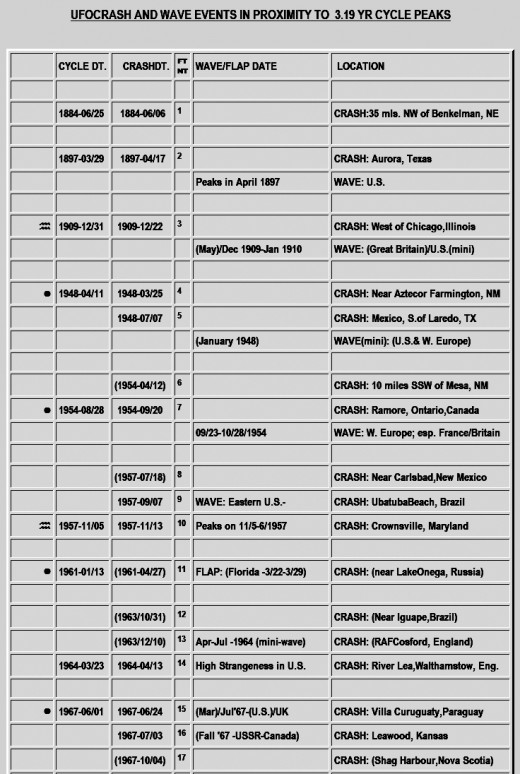
One thing that I found in my study was that there was a proportional relationship between my newly discovered cycle of 3.19 years and a so called Mars cycle (that had UFO waves corresponding to it in 1952, 1954, 1967, and especially 1973) of approximately 776 days (or 25.5 months). The later cycle was almost exactly 2/3rds of the former one. There was also a correlation to the 25.5 month cycle when it came to UFO crashes, but not as significant as was the case for the 3.19 year cycle. I am including a list of both crash and non-crash cycles here for you to evaluate. Both indicate when there was a closest or near closest approach of Mars to the earth as well as peaks in the 5+ year cycle (commonly thought of as simply a 60 or 61 month cycle that I feel is more like 63-64 months). I believe that this last cycle had a peak in early January 2011 but, since it is such a long cycle, its influence is felt for 8 months before and after a peak. This could explain why there were such elevated sightings at the UFO Reporting Center in Washington state in the summer of both 2010 and 2011.
For the Doubting Thomas Types Out There
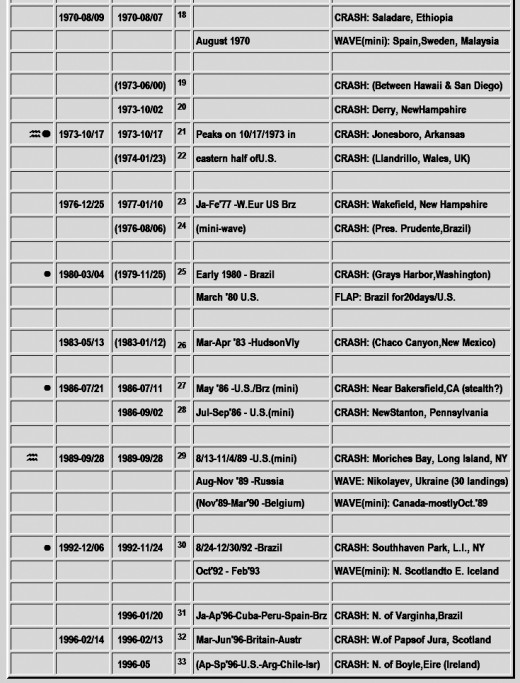
This analysis of 50 UFO crash reports from 1948 to the middle of 1989 was conducted over fifteen years ago. Many people have dished my decision to exclude data before 1948 to avoid the Roswell event. They seem to think that by including it that it would invalidate my hypothesis that there is something to a 3.19 year cycle related to such crash reports. I decided to test their hypothesis by examining such event reports for the year before and seven years after my earlier study.
Using information supplied by CSETI at this URL: http://www.cseti.org/crashes/crash.htm (no longer an active link) and, like I did 15 years prior, weeding out landings rather than crashes, supposed events with insufficient data (dead links or almost no info given about), duplicates, apparent meteors, and known or likely hoaxes, here is what I found: The number of events per year averaged 2.375 while the original study averaged 1.2 per year (i.e.-it would seem that I wasn't as critical in my screening this time as I was for the earlier study). Of the 2922 days examined it was determined that 863 days were cycle days. The expected average within the smaller window period comes out to 5.6 while, with 9 events determined to be within range of peaks of the 3.19 year cycle out of a total of 19 events, the results are 1.6 times greater than the expected average. Perhaps not as significant as in the earlier study (possibly because my selection process wasn't as critical as before) but it would appear that these results validated my earlier findings. A list of the crash reports used in this later analysis can be found at the end of this hub.
Non-Cycle Crash Chart Symbol Index and References
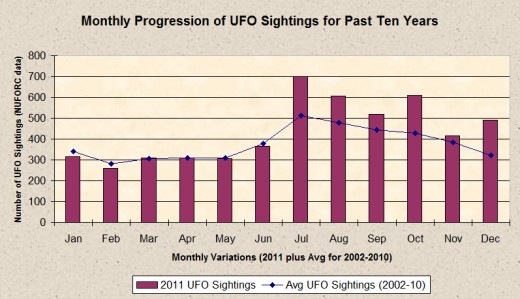
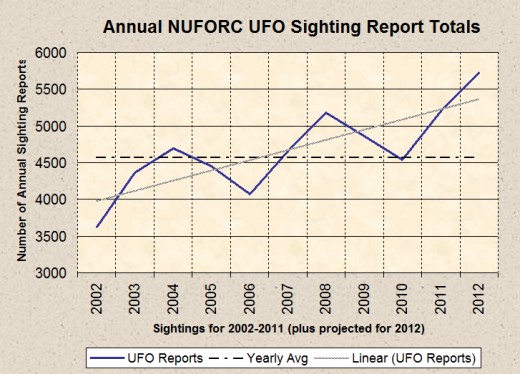
The reason I am publishing this hub now is mostly due to the fact that I wish to make it known, as I already have to the director of the UFO Reporting Center (NUFORC), that we are in the midst of a bigger UFO sighting scene than is usual for the first half of this year (director Peter Davenport has experienced first hand a record setting increase in sightings since July of last year but he has a wait and see attitude when it comes to future activity). January, usually a below average month for UFO sightings, turned out to be the biggest January ever for sightings.
Comparing the NUFORC data so far for 2012 to that of the first three months of the year from MUFON, the results are showing contradictory trends. MUFON, as is usual had only 88% as many reports for January as NUFORC had (468 to their 531), but in February the usual trend reversed itself; NUFORC now had 87% as many reports as MUFON had. NUFORC's director Peter Davenport recently announced that they would begin to scrutinize the reports more than they had in the past and it would seem that the change has already gone into effect. I am now curious to see how the full month of March will stack up when the second half of the reports for that month get posted. Based on the NUFORC data for December 2011 and January 2012, and the MUFON data for February and March of this year, it would appear that sightings peaked at around 1.58-1.56-1.63Xs greater than average amount in December 2011-January 2012-February 2012 period and was at the 1.49Xs greater than average level for March.
So March clearly is having above average results even if it is dropping off a bit. The reason that I felt March would have greater reports than usual is two fold: Not only is it close enough to January 26, the estimated date of the 3.19 year cycle's peak, but it also contains the date March 5, or when Mars will be at its closest point to earth in its orbit. March also often has at least average numbers of UFO sightings or one of the better months for the first half of the year. One thing that should be pointed out is that I also noticed that UFO waves and flaps (periods when sightings increase significantly above their average in wide or short areas of time and space) also correspond to my 3.19 year cycle. So even if there is no obvious crash (or even if there is you probably wouldn't hear about it right away), there is likely to be an upswing in sightings as I've already suggested.
As mentioned in an earlier hub (my UFO Window Report), there are also much shorter cycles that are measured in a matter of days rather than in years or months. But since, as related in still another hub (What Do Leap Seconds and UFOs Have in Common?), the UFOs (or aliens) are likely to come from our future, their days are probably longer than ours (by 1/2 hour per one of the proposed cycles). What that means is that the cycles don't quite mesh with days in exactly the same length and thus the seven day cycle proposed by John Keel in the '60s shifts forward a day every 50 days for one cycle and between 2.4 and 2.5 years for another cycle (at least that's the theory based on observing many reports over time). There is also a cycle that is shorter than a week by about 6 hours (perhaps relating to an advanced civilization that colonized the earth many thousands of years ago).
At the present time (April 2012), the primary day cycle (A) peaks on Friday night. By June, all three separate day cycles are expected to peak in unison on Sunday nights. The effects of the 3.19 year cycle will be fading at that point but still within range. June is also a transition month that represents a change in UFO activity from the more quite period of December through May to the increase in sighting experiences that usually accompany the period from July through October (November is a transition month as well but it bridges periods that are usually moving from a heightened to a weakened activity level). Because of these changes, sightings could slacken a bit in April and May before picking up again in June. However, the primary day cycle will be peaking on Friday and Saturday nights for those months so that a good portion of the best viewing should at least be conveniently timed.
.")
© 2012 Joseph Ritrovato