- HubPages»
- Technology»
- Computers & Software»
- Computer Science & Programming»
- Programming Languages
Data input for javascript - Ajax and the graphing calculator - part 1 in a series

A local Web Server (in Preparation)
Ajax is javascript's method for bulk input
Obtaining input is important towards making programs useful, because if there wasn't different data to produce different results, writing a program would usually be too much effort for a one-off result. That effort feels a lot more worthwhile, if it can be reused to save effort on similar projects. Data is what makes the same code do different things.
In my previous Hubs on the graphing calculator, I have gotten a limited amount of data from the user via a mouse click or a few entered characters. However, it is tedious for users to do a lot of data entry, which is why files are used for obtaining data in bulk. Given that javascript runs in browsers, it is necessary to restrict its access to files. Essentially, javascript can only read files via an HTTP request to the server that provided the Web page the javascript is running on. There is a native javascript method for doing this, but it is a lot more convenient to use jQuery, which is what I will do.
The technique of reading files off a server in order to dynamically update a Web page is often called, AJAX.
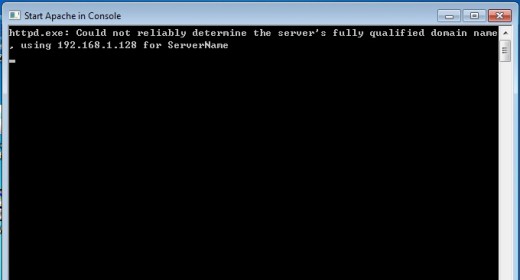
Using AJAX requires a bit more setup than my previous Hubs about drawing and animating with javascript. Specifically, you need to setup a Web server to provide files that javascript will request. You can do this locally on your own computer. How to set one up depends on your operating system and which Web server you want to use. I gave a link to how to setup an Apache Web server on Windows below, but you may need to search for alternatives.
Due to the "same origin" policy of browsers, javascript can really only conveniently fetch data from the Web server that provided the page the javascript is on. There are some ways around this via proxies or by running javascript in a priveledged mode, but they aren't very convenient and I won't go into them.
The first question to ask is, why would you want to have javascript access data that wasn't provided with the page the javascript is on? I think the answer is that your application needs data that the user will select, and it would be impractical to pre-load all of the possible choices. Think about how Google Maps works. It would not be practical to have the user first download all the map data for all the streets in the world. It makes a lot more sense to wait for the user to give an address, then fetch a relevant map.
The next question is, how am I going to make Ajax relevant to my graphing application? I think the basic idea is that I will graph data that comes from the real world, rather than an idealized equation, and I will let the user pick a subset of the data to graph, but I am still working out the details.
In this Hub, I will setup the code for plotting a chart based on a list of points and values.
In the next Hub in this series, I will use Ajax to fetch the points and values. I will make the application more real, later.
Convert an array into a path function
function makeplotfn( pts ) {
	var rfn = function( x ) {
		var ix = Math.round( x );
		if( ix < 0 ) {
			return( pts[0] );
		}
		if( ix >= pts.length ) {
			return( pts[ pts.length - 1 ] );
		}
		return( pts[ix] );
	}
	return rfn;
}
The code to the right creates a closure that turns an array of values into a path function. I discussed a similar technique for turning javascript math functions into closures in a previous Hub. This is a pre-requisite for my graphing calculator to be able to graph or plot something; I must supply it a closure that will provide the data for each point to be graphed.
a function for plotting descrete points
var testxpts = new Array();
var testypts = new Array();

testxpts[0] = -1;
testxpts[1] = 0;
testxpts[2] = 1;

testypts[0] = 1;
testypts[1] = 0;
testypts[2] = 1;


function jgplot( coord, xpts, ypts ) {

	var xfn = makeplotfn( xpts );
	var yfn = makeplotfn( ypts );
	var pfn = makepathfn( xfn, yfn );

	coord.scaleToCurve( pfn, 0, xpts.length, 1 );
	drawcurve( pfn, coord, 0, xpts.length, 1 );
}
The code at right contains a declaration of some x and y data points to be plotted and a function that plots a set of data points.
Add a page element to start the plot
<tr><td><img id="start_plot" src="jgplot.jpg" onClick="javascript:jgplot(unitsquare,testxpts,testypts)" /></td><td> </td></tr>
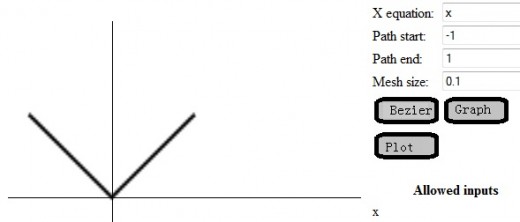
The fragment of HTML to the right is how the user causes the data to be plotted.
The resulting page and plot
- How to install Apache (and PHP+MySQL) on Windows: test your web pages at home - Web design tips &
An article about how to setup an Apache+PHP+MySQL web server in your Windows computer for testing purposes.
In order to prepare to actually use Ajax, you will need to install a Web server on your system or have a hosted account somewhere. I provided one link which may or may not be appropriate for you. You'll have to be a little intrepid about figuring out how and where to host your Web page and data.

 Games Ever")