- HubPages»
- Technology»
- Computers & Software»
- Computer Science & Programming»
- Programming Languages
JSON or XML - Ajax and the Graphing Calculator - part 2 in a series
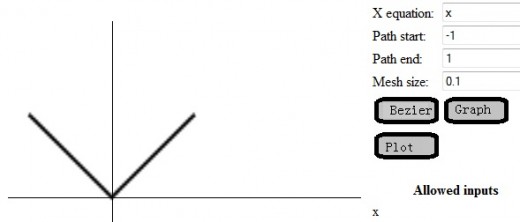
The same graph as my last Hub

Picking a data representation
In this Hub, I am continuing my exploration of Using AJAX to obtain data for my graphing calculator to plot. My previous Hub on data input gave the background for why I want to do this.
The file that my code will fetch to plot needs to be in a well defined format. Otherwise, it will be almost impossible for the code to discern the meaning of the data. A pretty much infinite number of different representations are possible, but two stand out. XML has a tag structure that is easily processed via jQuery. JSON is a syntactic representation of javascript objects that could be evaluated by the javascript engine directly. Strictly speaking, JSON doesn't include javascript code, just data declarations, but you might need a browser plugin or javascript library to enforce that restriction. I am also not convinced that data is necessarily harmless. So, I prefer to write my own code to ensure that the data I am getting is what I expected. For this reason, I will use XML and parse it with jQuery.
var mypath = {
	path : [ [-1, 1], [0, 0], [1, 1]]
};

....
eval( data );
JSON does have the advantage of compactness, and parsing is done for you. The JSON representation of my data would look like this. Once I received it, I could just have javascript evaluate it, or I could use a parser that is specialized to JSON. The latter would prevent any inadvertent execution of javascript that is in the data.
The same data as my previous Hub
<?xml version="1.0" encoding="utf-8"?>
<path>
<point>
<x>-1</x>
<y>1</y>
</point>
<point>
<x>0</x>
<y>0</y>
</point>
<point>
<x>1</x>
<y>1</y>
</point>
</path>
However, as I said, I chose to represent my data with XML. The first tag is necessary to convince some Web servers and Web browsers to treat my file as an xml file. Properly, I should use a standard document format or define a formal schema, but that is a lot of work which I won't get much practical benefit from. So, I didn't bother.
I used a "path" tag to encapsulate a list of points on the path. Each point encapsulates an "x" and "y" element. In the future, I could add additional dimensions to the point, and some descriptive information to explain what each element is.
For now, I am just trying to get something simple up and running, though. I don't want to get bogged down in too much elaboration early in a project.
The fuction for fetching a list of points
function getPath( url, coord ){
	var xpts = new Array();
	var ypts = new Array();
	var yi = 0;
	var xi = 0;
	$.get( url,
		"",
		function ( data ) {
			$( data ).find( "point" ).each( function () {
				$(this).find( "x" ).each( function () {
					xpts[xi++] = $( this ).text();
				});
				$(this).find( "y" ).each( function () {
					ypts[yi++] = $( this ).text();
				});
			});
			jgplot( coord, xpts, ypts );
	});
}
The function to the right uses jQuery to fetch and parse the XML file. get is one of a family of AJAX functions that jQuery offers. It like the others, calls a function once the data has been fetched. That function is where I translate the XML into a couple javascript arrays, and call the plotting function I developed in my previous Hub.
The HTML to call my new function
<tr><td><img id="start_plot" src="jgplot.jpg"
onClick="javascript:getPath('/path1.xml', unitsquare);"
/></td><td> </td></tr>Now, I just need to alter the javascript related to the onClick event of my "Plot" button to cause jgGetPath to execute and graph my points from data stored on my local Web server.
The resulting graph is the illustration at the top of this Hub. Basically, I've done some work to get back where I started; a pretty common approach in programming. In my next Hub on this topic, I will use this stepping stone to do something more exciting, though.


