- HubPages»
- Technology»
- Computers & Software»
- Computer Science & Programming»
- Programming Languages
bezier curves using javascript, SVG and jQuery - part 4 in a series
experimenting with SVG

Time to try something new; SVG
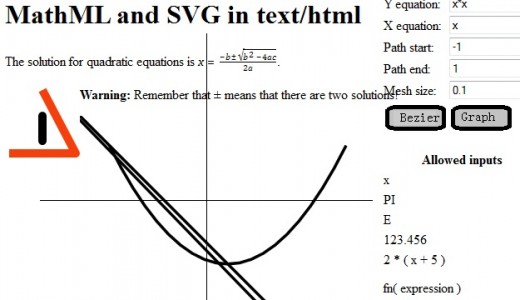
Firefox 4 includes support for in-line SVG (Scalable Vector Graphics). I suspect other recent browsers also have this support, or will soon follow. SVG allows one to draw with simple graphic elements (lines, polygons, circles, curves, ellipses) . It seems to me that the best way to integrate SVG with the graphing calculator and Bezier Curve examples that I have been developing, is to replace the curve drawing mechanism with an SVG's path element. It will be interesting to find out how SVG interacts with jQuery and with other DOM objects. I haven't done this before. So, it is likely to be messy. Hang on to your seats!
The first problem is that when I added an SVG element to my existing page, nothing displayed. I had to upgrade my jQuery to 1.5.1. Also, when I added the <!DOCTYPE html> declaration to the beginning of my file, the existing formatting went to hell, and the javascript that sets up the background and drawing surface after the page loads, interferes with the display of the SVG elements. ...Well,badly busted is easier to figure out than not working at all. At least, I have a few threads to pull on.
After some experimenting, I find that the initial background div seems to cover up any svg elements I put on the page. I'm not entirely sure why, but I'll come back to that. After ditching the "<!DOCTYPE html> meta tag and my background div, I got the SVG elements I borrowed from an example to work predictably. I then drew a couple of lines with the SVG line tag. The end result for this week is still a bit of a mess with many open questions, but definitely progress.
At first I thought to replace my line drawing routine with the SVG line tags, but after some consideration, it makes more sense to replace the curve drawing with SVG path tags. This will reduce the number of DOM elements the browser has to deal with, and I can take advantage of SVG's more professional job of line interpolation. The new curve drawing function is below.
drawing a curve with an SVG path element
function drawcurve( curvefn, coord, fnstart, fnstop, delta ) {
	var pt;
	var fofpt;
	var screenpt, newscreenpt;
	var path="<svg height=400 width=400 viewBox='50 50 450 450' style='position:absolute;'>" +
  		"<path stroke=black stroke-width=4 fill=none stroke-linejoin=round d='";
	var op = "M ";

	fofpt = curvefn( fnstart );
	screenpt = coord.pointToScreenCoordinates( fofpt.x, fofpt.y );
	for( pt = fnstart + delta ; pt < fnstop ; pt += delta ) {
		fofpt = curvefn( pt );
		newscreenpt = coord.pointToScreenCoordinates( fofpt.x, fofpt.y );
		if( screenpt.x != newscreenpt.x || screenpt.y != newscreenpt.y ) {
			if( op == "M " ) {
				path += op + screenpt.x + "," + screenpt.y;
				op = " L ";
			}
			path += op + newscreenpt.x + "," + newscreenpt.y;
			screenpt = newscreenpt;
		}
	}
	path += "'/></svg>";
	$( path ).appendTo( "body" );
}
concluding comments
The result is a cleaner looking curve, compared to the curves where I was using div elements to simulate pixels. I used jQuery to insert the new elements (svg and path) into my document, rather than the native javascript I used before. This makes the code a little simpler. So, I think this new technique is definitely an improvement over what I was doing before. One caveat is that not everyone is using a browser that supports in-line SVG. If i wanted a broad audience for my work, that might cause me to delay deployment.
In the next hub in this series, I will clean up and get the Bezier curve animation working again, using the new technique.
Finally, a word on why I am showing you my mess. Most teaching materials are polished and don't show the struggles of the teacher to learn the material. However, I thought it might be useful to share the process of how I learn something new. In someways, I think that process is the real skill that I have to share.


