Modern Portfolio Theory


Investment Evaluation
The NASDAQ exchange trades roughly five thousand stocks alone. If you consider all the investment opportunities open to investors in all of the countries around the world, it becomes clear very quickly that the choices are overwhelming, even if one has strict criteria for accepting stocks. In the next section, we will study some of the methods that security analysts use to evaluate different industries in an effort to narrow some of those many choices.
The Top-Down Approach
A key concept of modern portfolio theory
is that it implies a "top-down" approach to the creation of an
individual portfolio. It’s not enough just to look at the expected risk and
return of any one particular stock, but to invest in more than one stock and
gain the benefit of diversification. The main benefit in diversifying is a
reduction in the risk of a portfolio. The
risk that most investors take when they buy a stock is that the return will be
lower than expected and that there will be a deviation from the average return.
Each stock has its own standard deviation from the mean. This is what which modern portfolio management
calls "risk".
The risk in a portfolio of assorted individual
stocks will be less than the risk intrinsic to holding any single one of the
individual stocks, provided the risks of the various stocks are not directly
related. Consider a portfolio that holds two risky stocks: one
that pays off when the tides out and another that pays off when the tide is in.
A portfolio that contains both stocks will always pay off, regardless of
whether the tide is in or out. Adding one risky asset to another can reduce the
overall risk of a portfolio.
So it’s not just about picking stocks, but about
choosing the right blend of stocks among which to distribute one's capital. We create combinations of portfolios and identify the efficient frontier
and identify the optimal risky portfolio that all investors hold. Investors,
then, optimize their individual utility by dividing assets between the risk
free asset and optimal risky portfolio, that is, selecting a portfolio from
those combinations available on the capital allocation line.
Now let's look at some other approaches to portfolio management.
How Professionals Evaluate Industries and Companies
The research process consists of:
· Security analysis
· Security valuation.
The process, itself, is insensitive to the investment style of the portfolio manager, for example, “value” or “growth” stock. The manager’s style may, however, influence the universe of securities that are analyzed and / or the course of the research process.
Security analysts evaluate industries and companies for investment. Their goal is to discover a discrepancy between the "calculated" or intrinsic value" of a security and its market price. That’s why research efforts focus upon the discovery of market anomalies and high alpha common stocks.
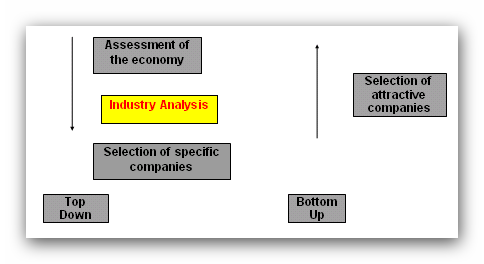
The research process may be “top-down” or “bottom-up.” A top-down process begins with an assessment of the economy, the relative attractiveness of different industries, and, finally, the selection of specific companies. A bottom-up approach seeks to identify attractive companies without reference to economic sensitivity or industry membership.
The Top-Down Approach
A top down approach begins with an analysis of the economic outlook. Historically, stock prices anticipate economic activity. Thus, while the economy is still mired in a recession, stock prices begin to rise in anticipation of economic growth and corporate profitability. Low interest rates, a by-product of recession-induced reductions in loan demand, spur home-building and mortgage lending.
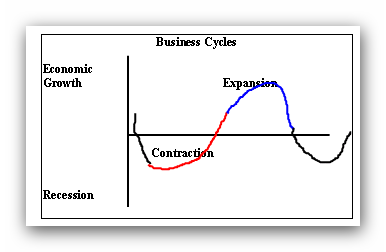
As the economy expands, consumers purchase capital goods and manufacturers begin to increase production. Later, manufacturers start to increase capacity by adding plant and equipment. At some point, though, consumers start to reduce their spending, manufacturers and retailers find themselves with excess inventory, and the economy begins to contract as consumption and production slow.
Leading Industries Lagging Industries
Perform well in expansion Perform well in contraction
Automotive Retailers
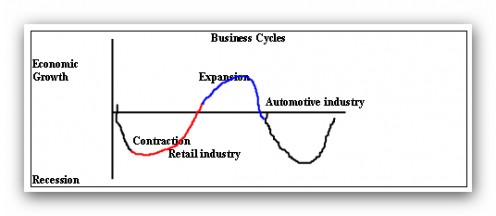
The top down approach relies upon the observation that patterns of economic behaviour repeat, in other words, the assumption that some macroeconomic relationships hold over time.
Here are some examples of the types of patterns that occur. While different industries do not perform the same and, further, do not perform the same consistently, the repetition of past patterns and trends is sufficient to make forecasts about the future course of an industry and / or company’s sales and earnings.
Many security analysts forecast industry profitability. While it’s often difficult to distinguish between cyclical (business cycle) and secular (long-term) changes, most industries follow a definable life cycle of growth, maturity, and decay that’s evident when sales are plotted against time.
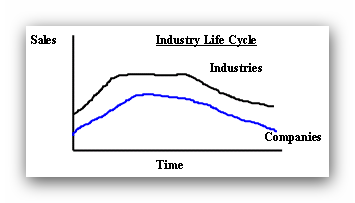
Companies follow a similar pattern of growth and decay. Profitability follows a predictable pattern of increasing profitability as sales rise and unit costs fall, until falling sales and / or sales prices, reflecting increased competition, offset the benefit of unit cost declines. Competition ultimately drives the profitability of all industries and companies towards the mean of all companies.
Structural factors such as the regulatory environment, technology, and demographics also affect demand for a company’s products. An aspect of industry analysis, the analysis of a company's customers, identifies direct competitors, the threat of new competitors (including “purchase” of market share), substitute products, and emerging technologies, as well as the bargaining power of suppliers and customers.
The Bottom-Up Approach (Analysis of company's financial statements)
Unlike the top-down approach, adherents of the bottom-up approach usually start with some preconceived notions about the type of security they’re looking for. The universe of available opportunities, all public companies, may be reduced by the application of valuation criteria and / or quantitative and subjective criteria.
A company analysis usually begins with an analysis of the company’s financial statements. This encompasses analysis of the major financial statements: the income statement, balance sheet, and statement of cash flows.
The du Pont model (tradeoffs available to a corporation's management)
· performance over time
· performance relative to peers/market
What’s referred to as the “du Pont model” identifies the financial tradeoffs available to a corporation's management. Ratios are used to express the relationship between two or more numbers. With ratios, we are able to compare the performance of a company over time, with its peers, and against the market as a whole, that is, the universe of all available alternatives. Ratios are also only as good as the underlying accounting data.
Thus, when reviewing the alternative methods a company can use to prepare its financial statements, we look for consistency over time and comparability with other companies in its industry.
Accounting versus Economic Earnings
g {earnings growth rate} = rate of return on equity x (1- dividend payout ratio)
Let’s distinguish accounting and economic earnings. Accounting earnings are affected by conventions regarding the valuation of assets and liabilities as well as expense recognition. Economic earnings are the sustainable cash flow that can be distributed without impairing the productive capacity of the firm. The sustainable earnings growth rate of a corporation, “g,” is the rate-of-return on equity times the earnings retention rate, which is 1 minus the dividend payout ratio. We’ll refer to “g” again when discussing the valuation of a security.
For example, if the rate of return is 9% and dividend payout ratio is 2%, we calculate the earnings growth rate as follows.
g {earnings growth rate} = rate of return on equity x (1- dividend payout ratio)
.0882 = .09 x [1 - .02]
How securities are priced
It’s widely accepted that stock prices are a leading indicator of economic activity and that stock prices incorporate information about future expectations. There is, though, disagreement about whether stock prices accurately reflect future earnings expectations or simply reflect a change in investors’ confidence about the future.
Common stocks may be “priced” on the basis of historical relationships or by sophisticated valuation models. Most investors use a combination of approaches.
Naive Methodologies
· historical price data
· forecasting ratios
Naive methodologies, preferred by some investors, rely upon accounting information. Investors might compare a company’s current market valuation with past extremes using, for example, the relationship of the company’s current price-earnings ratio to its range in the past. A common extension of this approach is to forecast ratios.
Ratio
| Basis
|
|---|---|
Price per share to book value per share
| Balance Sheet
|
Price per share to sales per share
| Income Statement
|
Price per share to earnings per share
| Income Statement
|
Book Value = Assets - Liabilities
Shares Outstanding
“Book value” refers to the firm's shareholders' equity per share, alternatively assets minus liabilities divided by shares outstanding.
Specifically, an analyst will forecast a company’s future balance sheet and income statement items in order to forecast ratios that can be compared to current and past benchmarks. Comparisons might also be made between a company’s ratios and those of its industry or the S & P 500 as a proxy for the market.
Quantitative Methodologies

A quantitative approach that fits well with the use of modern portfolio theory is the development of a dividend discount model (“DDM”). A DDM relies upon forecasts of future earnings and dividends to determine the present value of a company’s shares. In the basic model it is assumed that the current market price is the discounted value of future dividends.
Three models typically used by analysts are:
Dividends remain unchanged, i.e., zero growth. Today’s market value is the present value of future dividends.
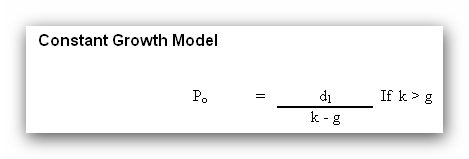
Dividends are expected to grow at a constant growth rate (assumed less than the discount rate). The company is funding growth internally; thus, the securities total return will be the sum of its dividend yield and growth rate.
Below is data for Snacks-R-Us, a large company that makes snacks. They have had a constant growth rate of 5% over the past years and they project that they will continue to grow at that rate. It has a free cash flow of $700,000 and weighted average cost of capital is 8.08%. They own $200,000 of stock in company XYZ, and they have 1,000,000 shares of stock outstanding.

Variable Growth Model
Inputs: earnings
dividends
growth rate
number of years in each phase of life cycle
Dividends are expected to grow at a variable rate. An assumption is made that future rates of growth are variable. Thus, today’s price is the present value of future dividends before the onset of constant growth plus the present value of the security’s terminal value. This model replicates assumptions about the industry life cycle and the future course of company profitability. The variable growth model is a combination of the constant growth, during phase II (rapid growth), and the zero growth, during phase III (maturity / stabilization), models.
An analyst must estimate the earnings, dividends, growth rate, and number of years in each period. Mathematically this model is more complex. But, using a computer, it is a simple matter to generate the price for a specific discount rate that can be compared to the “required price” from the capital asset pricing model.
Investment Analysis

Factors That Affect Equity Prices
To summarize, you should understand that analysts price individual stocks based on a company's earnings, dividends, projected growth rate and the required rate of return given the stock's level of risk. Now let's look at the factors that affect the overall stock market and tend to propel stocks in a certain direction.
Each of the statements here contains a news bulletin about some piece of economic data. It is our job to determine the likely reaction of the stock market.
Example 1:
Both houses of Congress passed a bill today authorizing an increase in the marginal tax rates for the wealthiest Americans and U.S. corporations. The bill proposes to use the new tax revenue to increase defence spending and spending for Medicare. The President is expected to sign the bill.
What effect is this likely to have on the stock market?
A) The Dow Jones is likely to rise.
B) The Dow Jones is likely to fall.
C) The Dow Jones is likely to remain unchanged.
The most likely reaction is: Wall Street reacted to the news and ended the day down 55 points. This is known as a change in fiscal policy. A government’s spending and taxation decisions are referred to as its “fiscal policy.” While politically controversial, most investors believe that higher government spending and taxation are detrimental to stock prices.
Example 2:
The Federal Reserve Board announced today that it intends to cut the discount rate, that is the rate at which the FED loans funds to banks, by another 1/4 percentage point. This is the third rate cut in as many months.
A) The Dow Jones is likely to rise.
B) The Dow Jones is likely to fall.
C) The Dow Jones is likely to remain unchanged.
The most likely reaction is: Wall Street reacted sharply to the unexpected change in monetary policy and closed at a record high level. Numerous academic studies suggest a linkage between money supply, interest rates, and stock prices. There is an inverse relationship between interest rates and stock prices that is attributable, in part, to the cyclical nature of the economy. Stock prices typically lead economic activity while interest rates lag economic activity.
The Federal Reserve Board influences economic activity through monetary policy, specifically, reserve requirements (the reserve banks maintain to protect depositors’ funds), open market operations (the means by which the Federal Reserve manages the money supply), and as we saw here, the discount rate.
The nation's leading economists reported today that a mild recession is forecasted in the coming year. They cite an increase in manufacturing inventories and a decrease in consumer spending on luxury items. They project that the recession is likely to last only about 2-3 quarters.
Example 3:
The nation's leading economists reported today that a mild recession is forecasted in the coming year. They cite an increase in manufacturing inventories and a decrease in consumer spending on luxury items. They project that the recession is likely to last only about 2-3 quarters.
A) The Dow Jones is likely to rise.
B) The Dow Jones is likely to fall.
C) The Dow Jones is likely to remain unchanged.
The most likely reaction is: The business cycle affects stocks differently depending upon the nature of the goods that they produce. Investors label certain common stocks as defensive or cyclical, based upon their sensitivity to the business cycle. Companies that sell the “necessities of life,’ for example, food and pharmaceuticals, are presumed insensitive to the business cycle. Service companies are perceived as economically insensitive and manufacturing companies as economically sensitive because of their high fixed costs, that is, operating leverage. Financial leverage, whether short or long-term debt, also enhances economic sensitivity.
Subjective Risks of Stock Investing
There are three risks inherent in stock investing.
Purchasing power risk is the risk that the buying power of money will change.
Due to inflation/deflation
Due to change in foreign currency prices
Inflation and deflation reflect the growth and contraction of a nation’s money supply. In general, inflation is perceived as positive for tangible assets, like gold and other physical commodities, and negative for intangible assets, such as stock prices. Deflation has the opposite affect. A similar and related risk is that associated with foreign currency exchange rates, when investing in foreign stocks.
Liquidity risk is the risk associated with the inability to sell a security when desired.
Liquidity risk is the risk of not being able to convert a stock into cash quickly or at a fair price. Security prices established in liquid markets, that are those with a high number of shares traded daily, are deemed “fairer” because the greater number of market participants suggests that information is being efficiently priced.
Business failure risk is the risk associated with the bankruptcy of an investment.
Recall that as owners of a company, shareholders are subordinate to bondholders and other creditors in the event of bankruptcy. Thus, in the event of business default, it is possible that the stock shares would be worthless.


