Use Excel to track hubpages stats in real time (Part 2)


This hub explains how to use excel to track and report hubpage statistics. In part 1 we looked at how to create a live data link between excel and hubpages which refreshes in real time without any need for manual input. Now that we have live refreshable hubpages statistics in excel, we want to start slicing and dicing the data to make it more interesting and useful.
This hub will show a couple of tips to rank by colour our best and worst performing hubs, and I will also show how to create a simple formula to track average hub views per day.
Tracking average hubviews per day
Average daily hubviews are important because we want to see whether our hubs are rising or falling. While hubpages already does some of this to an extent (using the ranking arrow up and down key) we can make this a little more scientific and useful by calculating average daily hubviews over the current, 7 day, 30 day, ever periods. This will give us a good idea as to whether our hubs are rising, falling, gaining or losing momentum. It is a useful indicator to highlight which hubs are getting stale and need refreshing, and to what extent changes such as the panda updates impact on hubs.
The next few steps will show how to apply a quick ranking system to our hubs and how to calculate daily average hub views.
Step 1: Apply conditional formatting to create a "Heat Map" of our hubs
In Part 1 we looked at how to pull the hubpages statistics into excel and create a live refreshable link. Once we have formatted the data and cleaned it up we should have a refreshable statistics page in excel which looks identical to the stats in hubpages. See part 1 for instructions on how to get to this point

The first thing we want to do is to apply some conditional formatting to our statistics. This is a simple peice of formatting which color codes our hub-statistics to show which ones are doing well and which are not doing so well.
To do this, firstly highlight the 1 day column and then click on the conditional formatting button, then click on the color bars or coding you want to apply. I normally just go for the green-orange-red scheme. To do this highlight the column (i.e. 1 day) and click conditional formatting, then chose the scheme you want to go with.


Once we have applied the conditional formatting to the 1 day column, do the same with the 7 day, 30 day and ever columns.
What you should end up with is a green-orange-red color code system. This is a pretty easy way to view hub stats. Green means the hub is doing well, orange OK, red means not doing so well. Each time the stats refresh, the color coding will update accordingly, so it provides a quick and easy way to view your hubs and get an idea as to which ones are doing well.

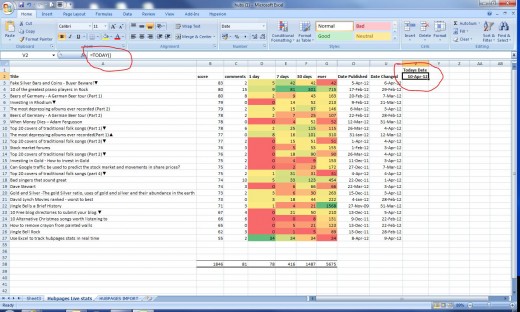
Step 2: Create a todays date formula
Next step is to start measuring average daily hubviews. This is a useful measurment because it allows us to spot trends more effectively than by just looking at the 1 day, 7 day, 30 day and ever hubviews.
To begin we need to create a todays date forumla. The todays date forumla is exactly that, it will show the current date and update every day to the current date. The forumla is very simple as follows:
=today()
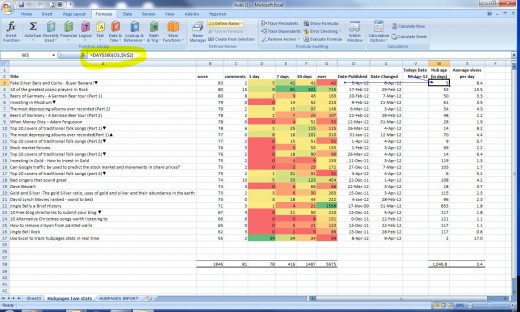
Step 4: Calculate the hub age by subtracting todays date from date published.
OK so once we have made the todays date forumla we then want to calculate the number of days since first published, or hub age (in days). To do this create another column to the right of our todays date column called Hub Age in days.
To calculate the hub age in days we take todays date and subtract the date published. To do this we use the days360 forumla as follows:
=days360(cell reference for "first published", cell reference for "todays date")
Make sure the todays date cell reference in the above forumla is fixed (ie hit F4 to put the $ signs around the referening)
Once you have made the hub age forumla copy it down the rest of the column for each hub row.
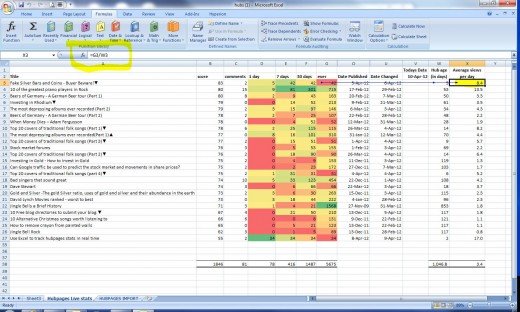
Step 4: Calculate average daily hubviews
Once we have created the hub age column, make another column to the right of this called average daily hubviews. Here we want to calculate the average daily hubviews our hubs are getting over thier life to date.
To do this simply divide the number of total hub views (per the ever column) over the hub age (in days) column.
Step 5: Compare 1 day hubviews to average daily hubviews
Now that we have calculated the average daily hubviews we want to compare this to our 1 day hubviews (current). Comparing the average daily hubviews to the 1 day hubviews allows us to quickly see whether our hubs are gaining or losing momentum (compared to historic stats).
To do this I am going to set up a new tab, and copy over the hubtitle, 1 day hub views, average daily hubviews, and total hubviews columns. As shown below:
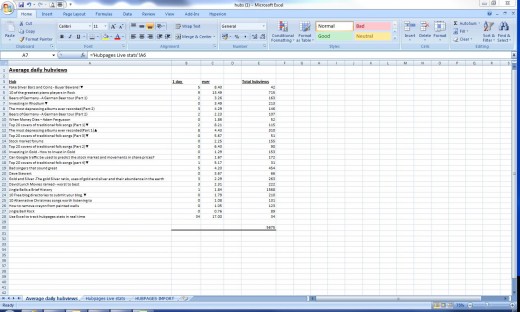
I am now going to tidy the formatting up on this worksheet and add some totals and some additional conditional formatting. I want to quickly see whether my hubs are currently doing better or worse against the historical average.
The below screenshot shows the finished formatted worksheet
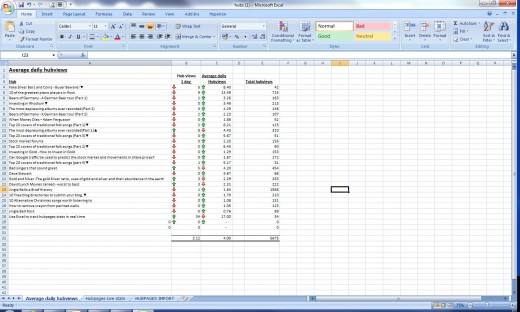
From a quick scan of the above I can see that most of my hubs are doing worse now than against the daily average hubviews (as indicated by the up green, down red arrows from the conditional formatting I applied. I can see that the current daily page views averages 3.12 views per hub, compared to the average daily hubviews ever of 4. This tells me on average that my hubviews are falling.
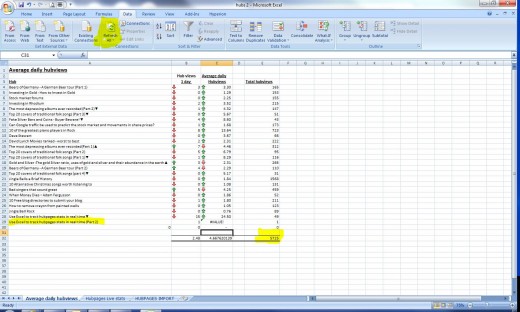
Now If I refresh the data, the stats should (fingers crossed) update automatically and I should see this hub appear on my new worksheet.
See below for recently refreshed data. The new hub (this one) automatically updates in my worksheet, but because it has not yet been published the date does not show and it is generating an error. This will be solved once I publish the hub.
In summary
This ends part 2, in this hub we looked at how we can use excel to calculate average hubviews and compare this against our current 1 day page views. In the next hub I will explore this idea a little further by comparing the current 1 day page views against the rolling average 7 day, 30 day and ever average page views. This will help us identify trends and get a good idea as to whether our traffic is rising, falling or staying the same.
Related Hubs
- Use Excel to track hubpages stats in real time
This hub shows how to create a direct link between excel and hubpages which automatically retrieves hubpages statistics and will update in real time.
Related

Create a 'Red Alert' in Excel With Conditional Formatting

How to create and use Sparklines in Excel 2010 to summarise and add context to your data and to also show trends

Excel: The Basics of Data Validation and Conditional Formatting

How Your Name and Birth Date Reveal Your Personality Traits

After 17 Years of Hubbing I Have Good Advice for Hubbers


