More Help To Ace Your SAT Math Test, Tip #4

Previous hubs have introduced the technique of applying actual numbers, then showed how to use this technique on problems that have equations – one-variable equations, multiple-variable equations, and equations in the answer choices. It’s time to move on to inequalities.
The key to applying actual numbers to inequalities is to be sure that the answer choice (1) includes everything it should and (2) excludes everything it should. Let’s take a look at a problem considered to be relatively hard.
Applying Actual Numbers to an Inequality
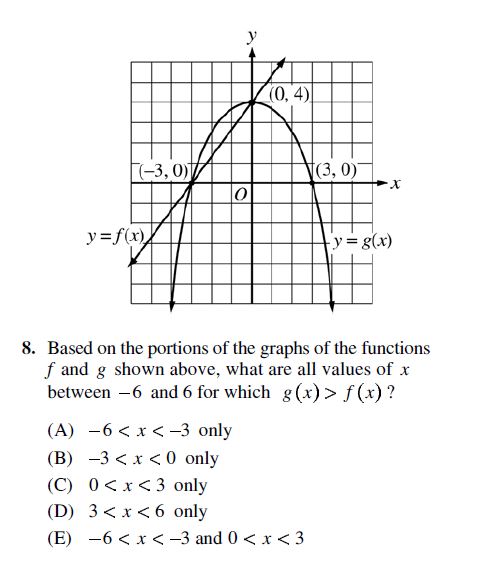

One of the things that makes this problem hard, quite frankly, is the deer-in-the-headlights effect that parabolas (the curved shape on the graph) have on some test takers. So the first thing to do is to overcome that feeling! The SAT never asks you to actually come up with a parabola’s equation. Instead, your job will be simply to make sense of what’s on the graph. And as long as you remember that the x value corresponds to how far a point is to the left or right, while the y value corresponds to how high or low a point is, this task won’t be all that difficult after all.
For starters, the parabola is labeled y = g(x), and the straight line is labeled y = f(x). This means that g(x) and f(x) correspond to the y value (not the x value) of the parabola and line, respectively. So when the question asks where g(x) > f(x), it just means, “Where is the y value of the parabola greater (that is, higher) than the y value of the line?” Let’s pick an obvious place where this is the case. How about where x = -2? Cross off each answer choice that does not include -2:
(A) -6 < x < -3 only ✗
(B) -3 < x < 0 only ✓
(C) 0 < x < 3 only ✗
(D) 3 < x < 6 only ✗
(E) -6 < x < -3 and 0 < x < 3 ✗
Cross off answer choices that exclude included stuff, or include excluded stuff,
Lo and behold, only one answer choice survives! Just for the sake of practice, though, let’s suppose that answer choice (E) read:
(E) -6 < x < 0 only
This inequality includes -2, so it would not have been eliminated in the previous step. In fact, if I pick any x value for which the parabola is higher than the straight line, (E) would still survive. At this point, then, I would need to pick a value that clearly should not be included. Since I need to choose between (B) and the new (E), I’ll pick a value that is included in one and not in the other. How about -4? Looking at the graph, I can see that -4 should be excluded, but the new (E) includes it. So I would eliminate (E) because it includes too much.
Inequalities versus Equations
The strategy I’ve been discussing works with inequalities a little differently than it does with equations. Although it occasionally happens, as above, that picking and applying one number gets you to one remaining answer choice, be prepared to pick and apply more than one number. Good numbers to pick will be:
- clearly within the given range (like -2 above)
- clearly outside the given range (like -4 above)
- near the the cut-off points for the range (I may have picked -2.9 above if I needed to)
More to come: I’ll be looking at two more kinds of SAT problems in the next two hubs. Notice that each of these hubs also applies to math problems on the ACT, GRE and GMAT. After the last two SAT hubs, the next subjects I plan to tackle are the special – and especially challenging – formats on the GRE and GMAT, and how to apply actual numbers to those kinds of problems. Those of you puzzled by Quantitative Comparison and Data Sufficiency: Help is on its way!


