Ecological Principles / Populations Ecology


Populations And How They Change
Ecology is the study of how organisms interact with their environment and with other organisms. Part of the study of ecology is learning about populations of living things and what affects their growth and decline. Covered on this page are the three main features of populations, types of growth curves, the categories that species have been placed in based on several characteristics such as how rapidly their population increases, the Hardy Weingburg principle, gene flow, genetic drift, natural selection, nonrandom mating, and distribution of traits.
This page is the fourth in a series on biology. It goes along with unit 4 in the Holt Biology Textbook: The Principles of Ecology, but can accompany other ecology or biology curriculums as well.
We took the photo of the blue and gold macaw (above) while at a zoo in the Bahamas. Macaws are very intelligent birds in the parrot family. If you're interested in finding out more about Blue and Gold Macaws, visit: Blue And Gold Macaws: Can They Really Talk?
The Study of Ecology
Ecology is divided onto four main categories.
Population ecology will be the focus of this page. After we finish population ecology, we'll move on to ecosystems ecology for the next page in this series.
- Population ecology - the number and distribution of individual species and the factors that cause those distributions.
- Physiological ecology -the response of a species to various environmental conditions.
- Community ecology -the number of species found at a location and how those species interact.
- Ecosystems ecology -the study of all the species that live together in a habitat., as well as all the physical aspects of that habitat.
Populations - Growth and Decline - Study Guide

Population has to do with the number of living organisms of a particular species in one location at one time. So we could talk about the population of bees in the hive in our backyard, or we could talk about the population of bees in North America. We could talk about the population of black bears in the North Carolina Mountains, or we could talk about the population of black bears world wide.
Populations grow as individuals have several offspring, yet there are also factors which limit the growth of a population.
There Are 3 Important Features That Influence Population Growth And Decline.
Those features are:
Population Distribution - Evenly, Randomly, and Clumped

- Population size - Smaller populations are much more likely to become extinct.
a. Smaller populations may be wiped out by natural events (fire, flood, etc).
b. Smaller populations are often subject to inbreeding, which means individuals mating with their relatives. Inbreeding produces a population in which the individuals are all very similar genetically. This can lead to harmful traits, as recessive traits are passed down from both parents to their offspring. - Population Density - Population density means the number of individuals of a particular species that live in one area. A dense population would have many individuals of that species living in an area, whereas a much less dense population might have only a few individuals living in the same size area.
If there are not many individuals living in a particular area, reproduction is less likely to occur. - Dispersion - is the way that the individuals are arranged or spaced within their environment.
a. Evenly (at regular intervals) - See the top image below.
b. Randomly (no specific pattern) - See the middle image below.
c. Clumped (bunched together in several groups, like a herd here, and another herd over there.) - See the bottom image below.
Population Dispersion Diagram by Yerpo
Types of Growth Curves
The Growth Rate of a population = the birth rate minus death rate of a particular population.
When a population has an exponential growth curve, the population increases at a steady rate. On a graph, it resembles the letter J.
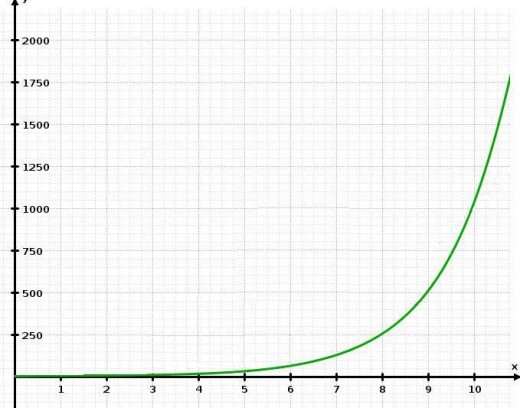
Exponential growth curve of a population
Graph is adapted from one created by McSush.
With a logistic growth curve, the population increases at first but then levels off. On a graph, it resembles a relaxed S.
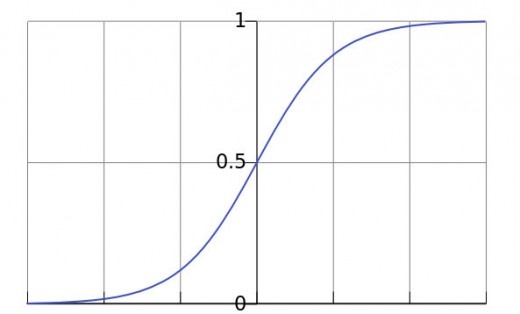
Logistic Growth Curve of a Population
Graph is adapted from one by: Qef
The reason that the growth slows down and levels off is because of density-dependent factors. Density dependent factors are resources that may become in short supply as a population increases. Food and water are examples. The population increases until it reaches the highest amount the environment can sustain. The highest population that the environment can sustain is referred to as that population's carrying capacity.
Density-independent factors are environmental conditions, such as weather or climate, which can limit the growth of the population in other ways. Density-independent factors are not based on the size of the current population, like density-dependent factors are. Mosquitoes are an example of a population that's affected by density-independent factors, because the mosquito population increases in the warmer months and decreases when the weather gets colder.
Two Basic Growth Patterns - K-strategists and r-strategists
Organisms that live in environments that change rapidly must be able to quickly grow and reproduce when the environment allows. They don't have the luxury of a long childhood or a long life, as they must reach maturity and be able to multiply quickly before the weather or other environmental conditions change. These animals are known as r-strategists.
K-strategists, on the other hand are animals that live in an environment that doesn't rapidly change. They usually have a long childhood and reproduce much later in their lives than r-strategists.
- r-strategists
examples: Cockroaches, mosquitoes, bacteria, weeds
Develop large populations rapidly
Populations drop quickly in numbers as environmental conditions change
Organisms reproduce early and have many offspring
Offspring reach adulthood quickly with little parental care
- K-Strategists
Examples: Whales, Tigers, Gorillas, Elephants, Humans,
Organisms grow slowly and have a long life span.
Population is usually near carrying capacity.
Organisms reproduce later in life.
Adults take care of their young for a long time.
Dandelions are r-strategists.

Gorillas Are K-Strategists

The Dandelion is an r-strategist because it lives a short life in a rapidly changing environment and reproduces early. The Gorilla is a K-strategist because it lives a long life, with a long childhood. The gorilla doesn't have to hurry through it's childhood in order to be able to reproduce before cold weather comes!
The Hardy-Weinberg Principle
states that the allele frequencies (the number of times particular genes appear) in a population remain constant (unchanging) from generation to generation unless something happens to change them.
The Hardy-Weinberg Principle - Study Guide
The Hardy-Weinberg Principle states that how often particular alleles (genes) appear in a population does not change unless it's in response to evolutionary forces, such as natural selection. Those evolutionary forces include:
- mutation
- genetic drift (change in the alleles of a population due to random occurrences, such as fire or landslide. Genetic drift usually affects small populations more than it affects larger ones. If the random occurrence wipes out a large number of a small population, some alleles may be wiped out of that population, which means that future offspring will be more similar to one another.)
- gene flow (movement of individuals into our out of a populations. If individuals come into a population, they bring new genes with them. Likewise, if individuals leave, they take their genes with them.)
- nonrandom mating (inbreeding, mating with others similar to you, selecting mates based on certain qualities, etc.)
- natural selection (If certain alleles create individuals that are more likely to survive and reproduce, those alleles are likely to increase in that population)
a. Natural selection works on phenotypes (the physical expression of a trait) rather on genotypes (the specific alleles that are present). So, because there are considerably more individuals carrying a single copy of a recessive gene (and thus not exhibiting that trait) than individuals who carry 2 copies of the gene (and therefore do exhibit the trait), disease causing alleles continue to be passed down from one generation to another, and are thus not eliminated from the gene pool.
b. Natural selection can affect regular traits as well as polygenic traits (traits influenced by many genes - such as height or skin color in humans). For polygenic traits, natural selection can influence those genes that affect the trait the most to a greater degree.)
Regarding the videos above
Don't let the math equation that Mr. Anderson shows you scare you! Just keep watching. :-) Really!
Distribution of Traits
A normal distribution of traits looks like a smooth hill on a graph. With height, for example, you'd have a few short people, a higher number of average height people, and then a few tall people. On a graph, it looks like a gradually sloping hill. It's often referred to as a bell shaped graph.
Sometimes certain factors change the pattern from a normal distribution to one of the following:
Distribution of Traits

- Disruptive Selection - This is caused by pressure in the middle, which sometimes divides the population in two. A disruptive selection graph has two hills with a valley in between, a little like a very loosely drawn m.
- Stabilizing Selection - Stabilizing selection increases the similarity of organisms in that population. Mr. Anderson uses the example of birth size. Babies who are born too small may not survive, and babies that are too large may have trouble being born, so the vast majority of babies are in the middle range. In stabilizing selection, the "hill" on the graph is much steeper than it is on a normal distribution graph. There are less extremes, and more in the middle.
- Directional Selection - In directional selection, the "average" or "norm" shifts a little one way or the other. In the video below, Mr. Anderson gives the example of a population of birds that shifted towards having larger beak sizes. It's like taking the hill shaped curve and scooting the whole thing over a little.
Population Ecology Resources and Labs - The Hardy Weinberg Law
- Population Genetics and Evolution
This ecology resource covers the Hardy-Weinberg law of genetic equilibrium. - Population Ecology Labs
This is a collection of labs for studying population ecology. - How does competition affect population growth?
This is an animated virtual lab for learning about growth curves.
Ecosystems
Our next chapter is on Ecosystems.
Science And Homeschool Resources
- The Homeschool Club on Facebook
Discover more homeschooling resources by visiting the Homeschool Club on Facebook! - Learn Physics, History, and More with Catapults!
This is a unit study on catapults. Included are the directions for how to make several catapults, lessons on levels and other simple machines, a brief history of catapults, lots of photos of different types of catapults, and more.
Biology
A list of pages in this series
Homepage: Biology: Information, Videos, and Labs
Unit 1 on Cell Biology
Unit 2 on Genetics
Labs, Information, And Videos For High School Students Studying Genetics.
Unit 3 on The History of Life on Earth
Unit 4 on Ecology
Ecological Principles / Populations
Biological Communities - Symbiosis, Niches, and Biomes
Global Changes And The Environment
Unit 5 on Diversity
An Introduction to Taxonomy - The Kingdoms and Domains Of Life
Learning About Viruses And Bacteria
Protists: Paramecium, Amoebas, Algae, Diatoms, Euglena, and Others
Unit 6 on All About Plants
Unit 7 on The Animal Kingdom: Invertebrates
The Animal Kingdom - An Introduction
The Cnidarians: Jellyfish, Sea Anemones, Hydrozoans, and Corals
Earthworms, Christmas Tree Worms, Leeches, and Other Annelids
Check back later for additional biology units!


