The 2025 Inflation and Recession Watch
Thought it was about time to devote a forum to just likely outcome of Trump's so-called Bold Agenda, you know, the one that is taking America down with it.
There are several parts of his "agenda" that will likely cause inflation and recession. The two biggest are his draconian immigration policies which are destroying the lives of millions of immigrants and citizens alike and the TACO tariff program.
How will this happen?
On the immigration side, Trump plans to reduce our workforce by about 2.4% once he deports all the citizens and non-citizens he wants.
Recession can occur from the loss of demand from the 4 million+ no longer buying things in the US (plus lower demand from another 2 million or so workers who lost jobs because businesses went bust due to lack of labor).
Inflation can occur from lower supply due to lower economic activity.
On the tariff side, inflation is a mathematical certainty. The only question is how much. You cannot make things more expensive to produce or purchase without driving inflation.
Recession and easily follow from lower supply as businesses fold under reduced demand and higher costs. It is expected that if Trump gets his way, GDP will decrease by 1% to 2.6%.
We are seeing this in real time now.
* For the first 6 months of Trump's term, GDP grew at a measly 1.23%. And this is before his higher tariffs take effect on Aug 8 (his latest "deadline").
* PCE, the Feds inflation gauge, had been getting very close to its target of 2% as Biden left office. But it reversed course when Trump took over. Core (the less volatile) PCE was 2.8% at the end of 2024. It dropped to 2.6% by the end of Jan 2025. It was back up to 2.8% in June 2025 and projected to be the same in July.
* Other CPI measures are more worrisome and can be gotten into latter
* The July labor report was a bombshell of bad news since it showed an almost stalled labor market in its May and June revisions, and an anemic 83,000 in July.
* Unemployment ticked up t0 4.2% while the Labor Force Participation Rate is down to 62.2%, the lowest since 2022. One of the reasons for the declining rate is the lower participation of foreign-born workers - 341,000 fewer in the latest measure.
* The chances of recession are down overall but range between 30% to 50% depending on who you ask. There is one outlier, and AI-based model, that has the chance of recession by year end at 71%.
Clearly, things are not going in the direction that MAUGA thought it would when they voted for Trump.HOT OFF THE PRESS, sort of.
Trump wants inflation to increase fast now.
You’re absolutely right — the de minimis exception, which had already been phased out for Chinese and Hong Kong shipments earlier in 2025, was officially voided globally by President Trump.
What Changed — Explained
1. Initial Suspension for China/Hong Kong
On May 2, 2025, Trump revoked the de minimis duty-free exemption specifically for goods from China and Hong Kong, requiring tariffs up to 145% or flat fees on postal shipments.
2. Full Global Suspension
On July 30, 2025, Trump signed an executive order expanding the suspension to all countries. This order removes duty-free entry for any shipment ≤ $800, effective August 29, 2025.
Non-postal imports will be treated like standard entries (full tariffs, documentation). Postal shipments will temporarily face flat duties ($80–$200/item) before transitioning to ad-valorem tariffs.
3. Earlier Legal Mandate to End De Minimis in 2027
The One Big Beautiful Bill Act, signed on July 4, 2025, legally repeals the statutory de minimis exemption effective July 1, 2027. But the executive order accelerates that timetable.
Why It Matters
Government Reasoning
The administration cited [FAKE] national security concerns, arguing that the exemption was exploited to traffic illicit substances like fentanyl, and to evade tariffs.
Economic & Trade Impact
Over 90% of U.S. cargo formerly qualified as de minimis, underscoring the vast scale of shipments affected.
Platforms like Shein and Temu, and small businesses on Etsy, eBay, relied heavily on this exemption—now they will face steep cost increases.
The Information Technology and Innovation Foundation (ITIF) warns the new policy will sharply reduce access to affordable cross-border e-commerce and strain customs infrastructure.
This is possibly another TACO maneuver by Trump.
https://www.cnn.com/2025/08/03/business … temu-sheinI looked deeper into this. If I read it correctly, this will shut down Amazon, Temu, Shein. Why? Because the duty is per "item" being purchased.
Example
Let’s say you order three different products from Vietnam (a country facing a 20% U.S. tariff):
You would be charged:
3 items × $160 = $480 in duties, likely passed on by the merchant or shipper.
If those same three items came from France (with <16% average tariffs):
3 items × $80 = $240 in duties.
If it comes from a country with a >25% tariff, then the duty is $200 per item, so in the example above, the cost would be 3 x $200 = $600 added on to what ever item you bought!!.
Do you really think the seller is going to eat those costs or the buyer pay them? I don't think so, they will simply go out of business and Americans will simply do without.
My wife just paid $8.49 for a jar of mayonnaise that use to cost a little over $6. Likewise, she just paid $6 and change for a bottle catsup that used to cost a little over $4.
I just paid $5 for a small shake at DQ.
Recessions are good for the rich.They can be, unless they are big ones like the Great Recession or Great Depression.
Bush's recession actually reduced inequality a smidgeon. But it took the Great Depression (made worse by a Trump tariff look-a-like) and WW II bring income and wealth inequality down to something that was reasonable.
Unfortunately, all those gains are long gone.
I spent the last week, with the help of ChatGPT, working on a set of composite indices to give us an idea of where Trump's economy is headed. I started with one combined index, but that didn't fit with reality over the long-term (back to 1990). I ended up with a set of three - one (Temperature-10) to measure the current temperature, another (Baro-10) to give us a since of where we are and where we are headed, and a third (Baro-L) to look further out in time. Each index is a composite of 10 other indices reported by FRED.
Everything is normalized to a 0 - 100 scale where 50 is neutral, 0 is terrible and 100 is great.
Taken together, they map pretty much the real world, at least since 1990.
Here is what it is telling us from Feb to Sep (with Sep being squishy because not all the various reports are in)
TEMP-10:
* Feb–Jul: decent but not hot (71–78).
* Sharp drop Aug–Sep to 57.9 → 56.7
* Takeaway: the slowdown arrived in the coincident data in late Q3.
BARO-10:
* Feb–Jul: strong (low–mid 80s).
* Aug–Sep: clear cooling to 77.7 → 72.3
* Takeaway: momentum was robust through midsummer, then softened—but still above neutral (50).
BARO-L:
* Early warning dip May–Jun to 65–67 (z 0.05–0.10) → rebound in Jul to 81.5, then eases to 69–74 by Sep.
* Takeaway: signaled a soft patch ~2–3 months before the others (May–Jun), flashed a brief improvement in July, and now points to sub-trend conditions (60s–low 70s).
CONCLUSION:
* None of the 0–100 series broke 50 to the downside yet. So this reads as a slowdown/soft patch, not a recession-style contraction.
* If Baro-L drifts <60 and Thermometer keeps sliding toward 50, risk for recession would increase.
If anyone wants a list of the sub-indexes, just ask. I think inflation comes out today, so I will run it again when it does.Overall CPI: Rose 0.4% in August on a seasonally adjusted basis, an acceleration from the 0.2% increase in July. Over the last 12 months, the all-items index increased by 2.9%.
Core CPI: Remained steady at 3.1% annually, unchanged from July and matching market expectations. On a monthly basis, the core index (excluding volatile food and energy costs) increased by 0.3%, the same pace as the previous month.
Key drivers: The increase in August was primarily driven by shelter costs, which rose 0.4%, as well as increases in food and gasoline prices.
And Trump has been blathering (LYING) for months how we have no inflation...
Waiting for Maga to say how pleased they are with this...I have added the new information into my model and will rerun it tonight to see what happens.
I reran it and as expected, it pointed to a worsening situation.
Joke for the day:
"Trump just said he solved inflation. But prices are rising - in part because of his policies"
Here is another Trump lie for MAUGA to repeat - "President Donald Trump declared on Friday that he’s “already solved inflation” and that “costs are down.”
https://www.cnn.com/2025/09/12/business … p-policies
But here is what IS TRUE - "Coffee prices haven’t surged this much in decades"
https://www.cnn.com/2025/09/12/food/coffee-prices
Speaking of coffee prices - my wife buys the Keurig pods, pack of 10, has gone up from $6.99 to $8.99 from Southeast Grocers. She has seen them at $10.99 elsewhere.Another sign of impending recession - CREDIT SCORES DROPPING
https://www.cnn.com/2025/09/16/economy/ … dent-loansConsumers keep spending when everything says they shouldn't be. That is making me think this may be a 2006 housing bubble-type phenomenon - when reality catches up with the pocketbook, disaster is not far behind.
Just like with the stock market's artificially high levels. All economic indicators say it should be falling, BUT, because the economy is so weak, investors are counting on the Fed to lower interest rates (I think today) so they are giddy at the thought.
https://www.cnn.com/2025/09/16/economy/ … es-august.Trump is killing our farmers. Just ask them.
https://www.cnn.com/2025/09/15/politics … terroristsWeekly Update (AI) to Trump ending the de minimis exemption.
Short answer: it’s early, but the end of de minimis is starting to show up in shipping costs, retail pricing, carrier volumes, and logistics. Any CPI effect so far looks small and hard to isolate, but forecasters expect some upward pressure on goods prices into the holidays.
Inflation (so far)
* There’s no clean CPI “de minimis line item,” and August CPI didn’t show a discrete jump tied to it. Analysts say tariff changes should add modest upward pressure to core goods over the next few months; think a slow pass-through rather than a spike.
[The Conference Board]
Prices & retail behavior
* Cross-border DTC players (e.g., Temu/Shein) are raising prices/cutting promos as formerly duty-free items now carry duties; mainstream brands flagged margin headwinds from higher tariff exposure.
[MarketWatch]
* Expect the biggest retail effects in apparel, small household goods, accessories, and low-ticket electronics—the categories most reliant on small direct imports. (Inference based on the mix described by Reuters.)
[Reuters]
Carriers & logistics
* FedEx guided a ~$170M profit hit this quarter tied to newly tariffed parcels; UPS volumes are under pressure too.
[Reuters]
* Postal traffic into the U.S. dropped sharply right after the change (UPU said >80%), as foreign posts paused or retooled services; some are gradually resuming.
[DC Velocity]
* CBP flipped the switches in ACE: Type 86 and Section 321 parcel clearances are being rejected, and entries now need formal/informal filings with duty payment (with a temporary flat-duty option in the transition).
[GovDelivery, Expeditors]
Government revenue / volumes
* Since earlier limits on China/HK and now the global end on Aug 29, 2025, CBP reports hundreds of millions of dollars in added duties (>$492M cited for the China/HK tranche alone). More global revenue data should post in the coming weeks.
[Reuters]
Consumer side-effects
* Confusion around new duties has brought a rise in duty-payment phishing/scams; consumer advisories are circulating ahead of holiday shopping.
[Business Insider]
Bottom line
* Inflation: any CPI impact to date is muted and hard to disentangle, but some pass-through to goods prices is likely over the next 1–2 months as retailers/carriers normalize.
[The Conference Board]
* Operational/price effects: clearly visible already—higher delivered prices, carrier costs, postal slowdowns, more paperwork, and added duties collected.
[Reuters, DC Velocity]I believe things will change when the Fed lowers the interest rate.
This will make it easier for businesses to borrow money, people to borrow money for housing, etc.
Thing will change for the better when this happens.The Fed lowered interest rates, but only because the economy is failing.
Problem is, in Fed-speak, we are at the front-end of a Reagan-style Stagflation cycle. It won't end until these draconian tariffs are removed.
By design of the Conservatives, the top 20% of income earners are now responsible for 63% of consumer spending (the top 10% spends 49%). The income gap is that large. Anyway, if, for whatever reason, the very wealthy decide to even slow down spending - recession here we come.
https://www.cnn.com/2025/09/18/business … y-spendingWith the rate cut, the Fed is telling us we are in the beginning stages of a Reaganesque stagflation cycle.
Here is an Econ 101 truism - if there is a shock to Demand (think the pandemic) then only inflation OR unemployment go up. If there is a shock to Supply (think tariffs) then BOTH inflation and unemployment go up. When Both go up, that is stagflation.
https://www.cnn.com/2025/09/17/economy/ … ting-finalThis is from Van Jones and represents the Charlie Kirk I am aware of:
"The day before he was horrifically murdered, Charlie Kirk sent me a direct message on X.
He and I had been sparring publicly over the killing of a Ukrainian refugee and its relationship to race.
He said the gruesome killing of a White woman by a Black man was motivated solely by anti-White hatred. I denounced those comments on CNN as unfounded. He went on TV and denounced MY denunciation. Then he unleashed a firehose of tweets, challenging my argument.
Kirk’s pushback sparked an online torrent of racist death threats against me, the likes of which I have rarely seen." - It is this threat of violence that Robinson may have been afraid of. I know it is what the gay guy in my office is afraid of - a right-wing Robinson coming to kill him for being gay simply because that is what Kirk verbally insinuates.
Van Jones then goes on to relate that Kirk invited him on his show to debate (who do you take the side of racists, but Kirk was going to try).
Van Jones then spends the rest of his piece arguing for the more peaceful path that Kirk offered him rather than the one Robinson took (out of fear, in my opinin) or the one Kirk's supporters want to take.
https://www.cnn.com/2025/09/19/politics … rk-message
.I spent the last week or so refining a set of composite economic indices to measure different aspects of the economy using ChatGPT (it would have taken me a month or better back in the day when I did this sort of thing professionally).
The data used is from FRED and goes back to 1990. I had a back-casting analysis run which concluded the set of indices and weights assigned did a very good job of tracking the economy historically.
Here is an explanation of the chart attached chart which captures the last five years.
How to read this chart
The dashed line at 50 is the long-run average (1990 - 2023). Above 50 = better-than-normal; below 50 = softer-than-normal.
* Blue (Barometer-10): a balanced index of labor, finance, prices, and output — think “overall conditions.”
* Orange (Thermometer-10): a more current read on activity — think “right now.”
* Green (Barometer-L): a leading read — tends to move a few months before the economy does.
What it’s saying now
* At the moment, the overall outlook is soft. The orange Thermometer has slipped to well below 50, signaling cooler-than-normal momentum in the latest data.
* Overall conditions are OK but wobbly. The blue Barometer-10 is a touch above 50, so not recessionary, but it’s been choppy — consistent with a fragile expansion.
* The next few months look better than the last few. The green Barometer-L has turned up and above 50, which historically points to firmer activity 3–6 months ahead if the lead holds.
Why the lines can disagree
* Different parts of the economy turn at different times. Leading pieces (credit conditions, jobless claims, housing-related signals) can improve before coincident pieces (spending, production) show it. A short-term shock (oil spike, credit event, policy surprise) could still flip the picture — but absent a shock, the lead index argues against a deep immediate downturn.
Bottom line
* Near-term: soft patch, below average.
* Baseline: still an expansion, not a clear recession signal.
* Outlook: improving odds of stabilization if nothing happens like increasing inflation.
Notes: These indices blend widely used data; they get revised as official numbers are updated. No single chart is perfect — use this as a dashboard gauge, not a guarantee.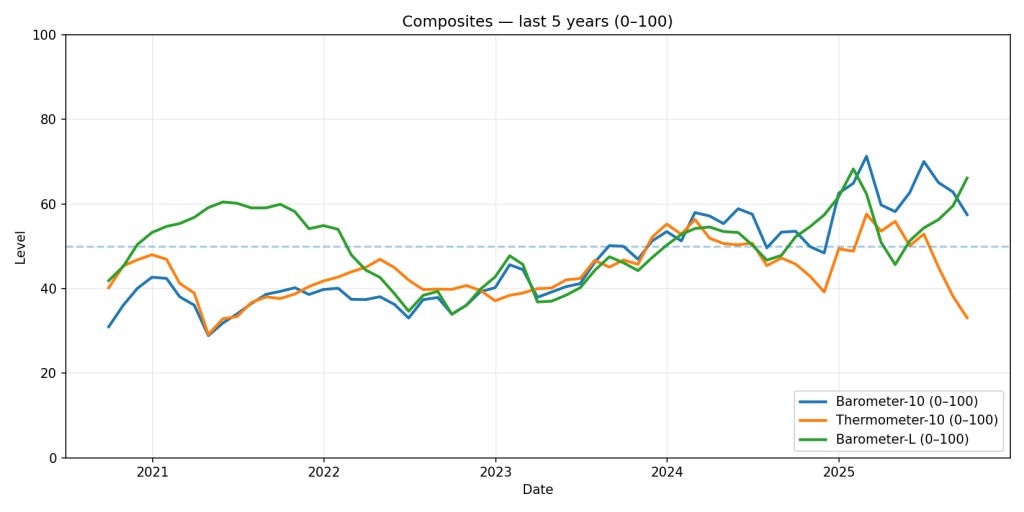
If there are any nerds out there, I can supply the indices currently being used upon request.
Also, I will run it again at the EOM after the next set of data has dropped.Federal Reserve Bank of Philadelphia
Third Quarter 2025 Survey of Professional Forecasters
Forecasters See Higher Growth in 2025
The near-term outlook for growth in the U.S. economy looks better now than it did three months ago, according to 36 forecasters surveyed by the Federal Reserve Bank of Philadelphia. The forecasters expect real GDP to grow at an annual rate of 1.3 percent this quarter, up from the previous estimate of 0.9 percent. On an annual-average over annual-average basis, the forecasters expect real GDP to increase 1.7 percent in 2025, up 0.3 percentage point from the estimate in the survey of three months ago.
A slight downward revision to the path for the unemployment rate accompanies the outlook for growth. The unemployment rate is projected to be an annual average of 4.2 percent in 2025 and 4.5 percent in 2026 before falling to 4.4 percent in 2027, and 4.3 percent in 2028. In the previous survey, the unemployment rate was forecast to rise from 4.3 percent to 4.4 percent over the same four-year period.
On the employment front, the forecasters predict job gains in the current quarter at a rate of 73,000 per month. The employment projections for both the current quarter and the following three quarters show downward revisions from those of the previous survey. The projections for the annual-average level of nonfarm payroll employment suggest job gains at a monthly rate of 132,800 in 2025, down from the previous estimate of 140,900. (These annual-average projections are computed as the year-to-year change in the annual-average level of nonfarm payroll employment, converted to a monthly rate.)
Lots of positive news, more to read
https://www.philadelphiafed.org/surveys … hatgpt.comThat seems to line up pretty well with and helps validate my work, but with these notes:
To summarize what they’re saying
* Growth: nowcast for Q3 real GDP of = ~1.3% and 2025 ≈ 1.7% is better than their last survey, but still modest. Remember, Trump wants >3% or 4% territory.
* Jobs: payroll growth was revised down versus three months ago - 73k/month current quarter compared to 133k/month for 2025.
* Unemployment: ~4.2% in 2025, drifting UP to ~4.3%–4.5% later
How that lines up with my indices (AI generated)?
* Thermometer-10 (coincident) is under 50 → says current momentum is soft. That fits a 1.3% GDP quarter and slower monthly job gains.
* Barometer-10 (overall conditions) is a bit above 50 → fragile expansion, not a recession call. That’s broadly consistent with 1.7% 2025 growth.
* Barometer-L (leading) has turned up, historically pointing to a firmer 3–6 month outlook which agrees with the SPF’s upgrade - but is subject to things like higher inflation, actual lower growth, and tariff turmoil.
Both the SPF and my tool suggest the same thing at the moment, soft-landing coupled with slow growth.
Their baseline looks like a soft-landing/slow-growth story.
Here is the latest on the ever rising inflation.
Changes from last week regarding the de minimis cancellation:
What changed vs. last week
We moved from “anticipated” to confirmed operations items: ACE deployment hit Oct 7, and Australia Post’s retail channel is back by Oct 7.
GovDelivery
+1
UPU’s status update now pegs flows at ~70% below normal (vs. early reports centered on the Aug 29 –81% day-of shock).
AP News
CPI timing is now formalized at Oct 24, so any pass-through effects from the de-minimis change won’t show in official data until then.
Bureau of Labor St
With BLS shut down, we have to look elsewhere for inflation news - it isn't good:
1) Business “prices paid/charged” surveys are hot.
ISM Services prices index was 69.4 in September—its 10th straight month above 60 (expansion = rising prices).
ISM World
ISM Manufacturing prices index was 61.9 in September—also solidly inflationary.
ISM World
S&P Global PMI commentary for late September notes ongoing selling-price pressure, even as growth cooled.
S&P Global
2) High-frequency/retail indicators show goods prices ticking up.
A private scanner-data firm (OpenBrand) reported consumer-goods prices rose in September—useful while official BLS releases are dark.
Reuters
The Minneapolis Fed’s daily pricing analysis finds a “slow-rolling” tariff impact as retailers pass costs through over time.
Federal Reserve Bank of Minneapolis
3) Direct tariff pass-through evidence.
P&G said it is raising U.S. prices on about a quarter of products to offset the 2025 tariff costs (mid-single-digit hikes).
Reuters
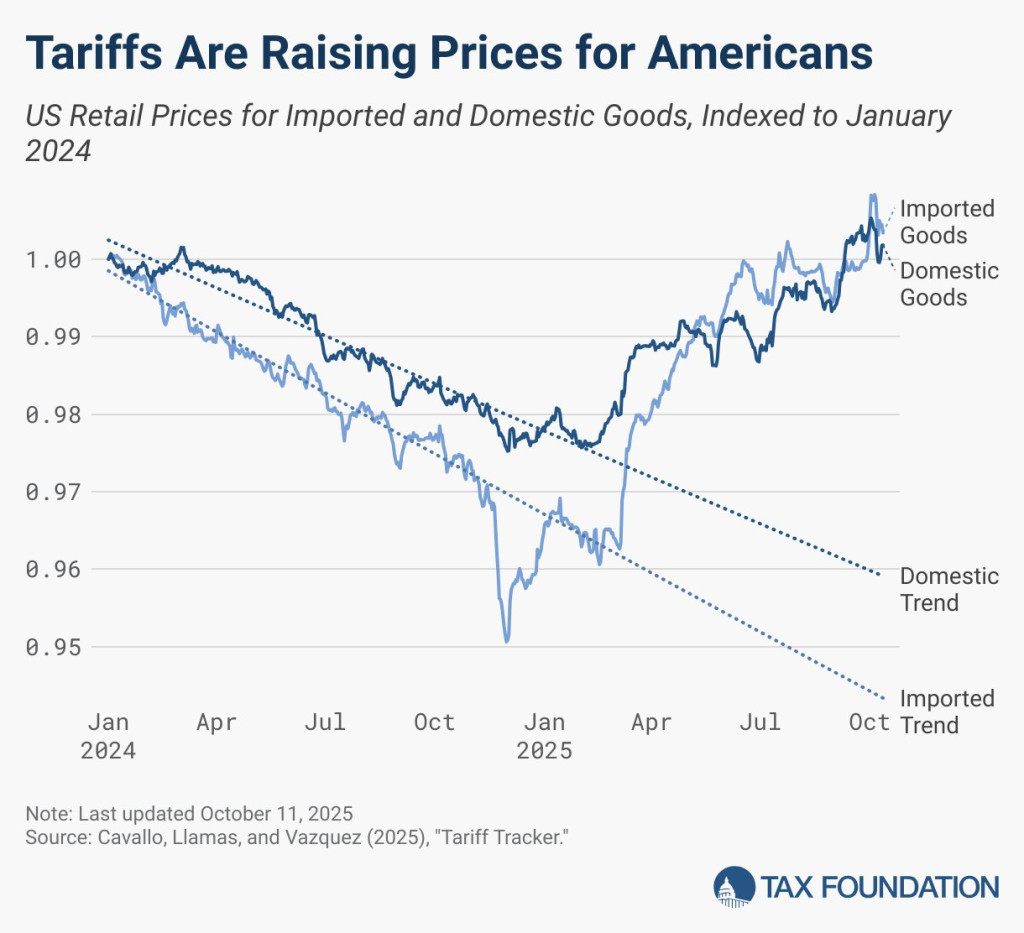
Fresh syntheses of company-level prices and academic work (e.g., Cavallo) show tariff costs largely borne by U.S. consumers, adding an estimated 0.3–0.75 pp to core inflation.
Reuters
A Yale Budget Lab note estimates 61–80% pass-through to consumer core goods soon after the 2025 measures—well within historical ranges.
The Budget Lab at Yale
4) Policymaker and forecaster signals.
Fed Chair Powell: tariffs likely cause a one-time level jump in prices “spread over several quarters,” lifting inflation in the near term.
Reuters
NABE economists and Fed officials highlight tariffs as an upward inflation risk even as growth slows.
Reuters
+1
5) Trade & logistics costs that feed into shelf prices.
China’s new retaliatory port fees on U.S. ships (and U.S. fees on Chinese vessels) raise shipping costs and frictions—an upstream price pressure.
AP News
Container and air-freight benchmarks (e.g., Freightos) show elevated, choppy transport rates on Asia lanes—another input-cost channel.
Freightos
+1
6) Category context.
Not everything is rising: rents have softened (Apartment List: -0.4% m/m in September, -0.8% y/y), which helps offset goods inflation from tariffs—but that’s a different price bucket.
Apartment ListThese businesses bemoan the fact that Trump destroyed relations with Canada. They are losing money because of Canada's reaction to Trump's aggression. They say they are innocent.
Well, if they didn't vote or voted for Trump in the last election, they are not so "innocent". Trump made no secret he was going to do this to Canada (and the rest of the world) and the consequences were easily foreseeable. There for those who didn't vote or voted for Trump bear some responsibility to what is happening to them now.
https://www.cnn.com/2025/10/13/business … iffs-tradeThese are showing up again! Who's eating beef these days?
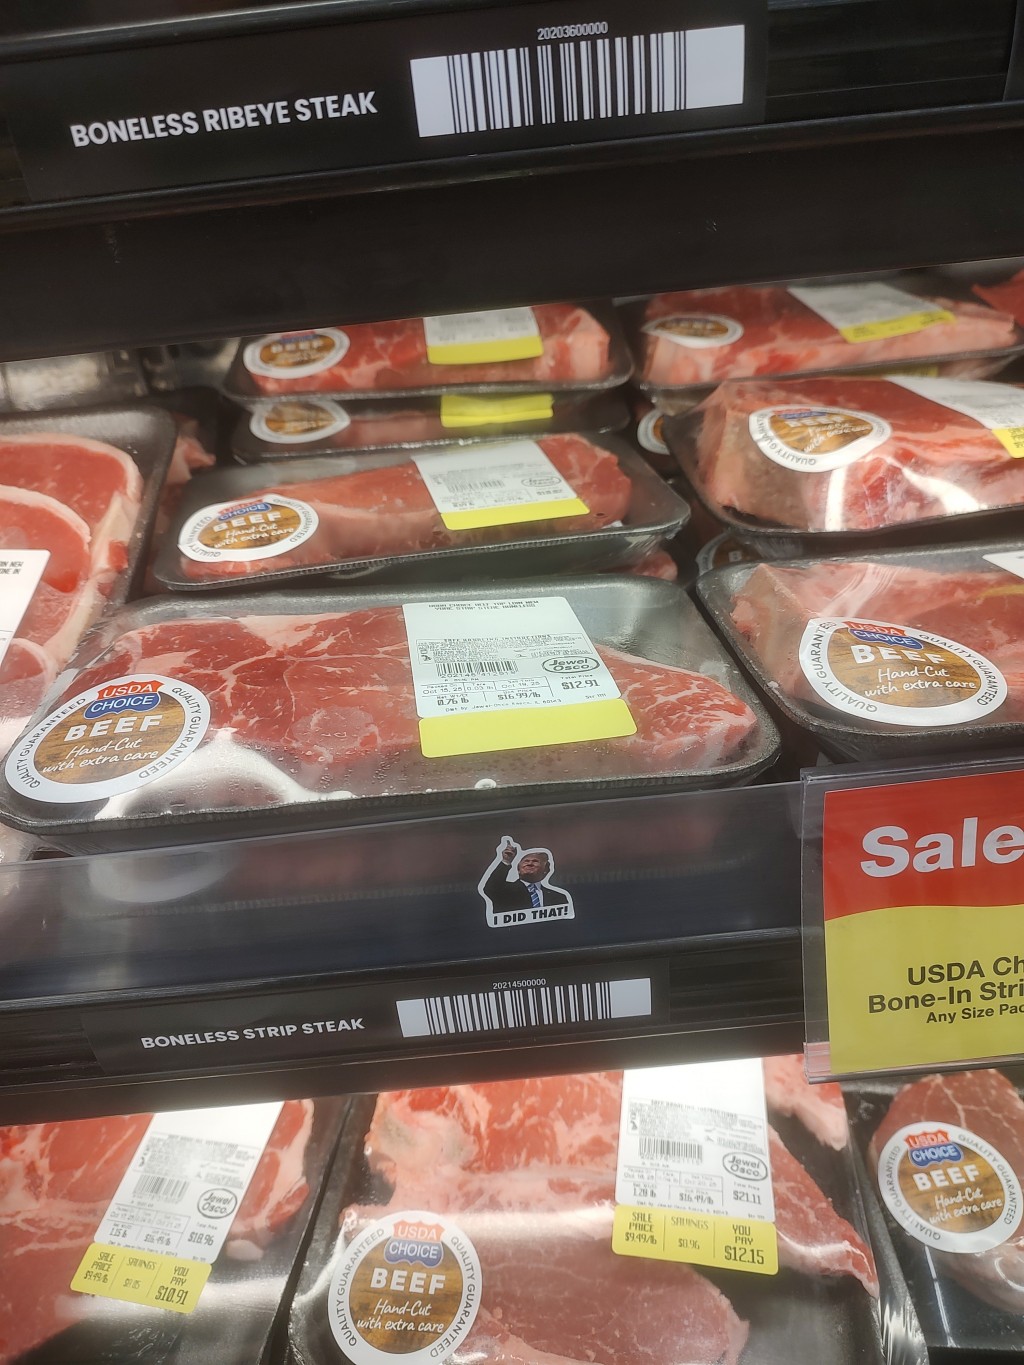
My wife and step-daughter only buy things like that when 1) they are on BOGO (buy one, get one) and 2) the store hasn't doubled the price to put them on BOGO. Our guest bedroom is now a pantry as she stocks up on BOGO items. That is how bad Trump's inflation really is.
Here is the weekly de minimis exemption suspension update (where Trump put tariffs on imports costing less than $800).
Here’s the weekly de minimis fallout update (week ending Sun, Oct 19, 2025) — what moved, with dates and numbers:
Oct 15 – Postal restart (India): India Post resumed all categories of U.S. services after ~7 weeks offline, using a duty-paid system (reports note a flat 50% duty applied to declared values).
Reuters
+1
Oct 14–17 – Carrier adjustments (UPS/AusPost): UPS briefly suspended then reinstated its Money-Back Guarantee for U.S.-bound international shipments amid de minimis disruptions (suspension Oct 2; reinstated by Oct 14). Australia Post acknowledged erroneous duty charges on U.S. returns and is issuing refunds.
CEP-Research
+2
UPS
+2
Status – Postal flows: UPU’s latest public snapshot (Oct 11) still shows U.S.-bound volumes ≈ −70% vs pre-Aug 29, with ~88 posts reporting partial/total suspensions while systems are upgraded. (No newer UPU figures posted this week.)
Fortune
+1
CBP operations/guidance: No new de-minimis-specific CSMS this week; the Aug 28–29 guidance (suspending Section 321/Type 86 for ineligible shipments) and Sept 22 update for postal “Qualified Parties” remain operative.
U.S. Customs and Border Protection
+2
GovDelivery
+2
Courts – briefing clock: In Trump v. V.O.S. Selections (consolidated), Supreme Court response briefs due Mon, Oct 20, amicus by Fri, Oct 24; case set for early Nov argument.
Supreme Court
Prices/data timing: BLS confirmed the September CPI will post Fri, Oct 24 at 8:30 a.m. ET (shutdown exception so SSA can finalize COLA). No other BLS series have resumed.
Bureau of Labor Statistics
What changed vs. last week
More lanes re-opened / stabilized: India Post fully back online (new this week), and UPS reversed its guarantee suspension—signals of operational normalization at the margins.
Reuters
+1
Consumer data still pending: CPI’s Oct 24 timing unchanged, so price pass-through won’t be visible in official data until next week’s release.
Bureau of Labor Statistics
Policy/guidance steady: No new CBP directives—traders and posts remain on the August/September rule set while integrations continue.
U.S. Customs and Border Protection
+1
Alternative Inflation Indicators
QUESTION - Since BLS still hasn't released data yet, what other indicators of rising inflation are there?
Here are non-BLS gauges you can use right now to spot price pressure while we wait for CPI:
PMI “prices-paid/received” are hot
• Services: ISM’s Prices Index = 69.4 (Sept) — historically high and up y/y, signaling firms are paying (and often charging) more.
Institute for Supply Management
+1
• Manufacturing: ISM Prices Paid = 61.9 (Sept) — down a touch m/m but far above 50 and ~+14 pts vs a year ago, implying upstream cost pressure.
Investing.com
+1
Regional Fed survey shows rising input and output prices
*The Philadelphia Fed October survey reported Prices Paid = 49.2 and Prices Received = 26.8, both higher and above long-run norms—firms say costs are rising and more are hiking selling prices.
Reuters
S&P Global PMIs flag higher output charges
* The October PMI bulletin (flash/early October) notes U.S. firms lifting output prices on persistent cost pressures, especially in services (details in their October roundup).
S&P Global
+1
Online price trackers (private) hint at stickiness
*Adobe’s Digital Price Index (category-level online prices) is one to watch for near-real-time moves as post-tariff restocking hits—useful while official CPI is deferred.
Adobe Business
Energy is not the culprit right now (helps offset)
* Gasoline is drifting lower (AAA national average ~$3.04 → $3.03 w/w; mid-Oct update notes a slide toward $3). That tempers headline inflation even if core categories firm.
AAA Fuel Prices
+1
Big ticket disinflation pressures remain (mixed picture)
* New-car retail prices hit all time high according to Kelley Blue Book (Cox Automotive). They report the average transaction price (ATP) for new vehicles hit a record $50,080 in September 2025—the first time the U.S. new-car ATP has topped $50k.
Kelley Blue Book | MediaRoom
+1
* Used-car wholesale prices fell ~3.4% in the first half of October (Manheim mid-month) — easing a category that previously ran hot. Market rents are also down 0.4% m/m, −0.8% y/y (Apartment List Sept). These counteract some of the upstream heat.
CBT News
+2
Manheim
+2
Bottom line: The business-survey side (ISM, regional Feds, S&P Global) is flashing ongoing cost pass-through—strongest in services—while energy and some goods (autos, rents) are easing. Net-net, that points to stickier core inflation pressure even if the headline is cushioned for now.
Finally, Consumer Indexes
Here’s the quick read on consumer indexes right now (non-BLS), as of Oct 19, 2025:
* U. Michigan Consumer Sentiment (Oct prelim): 55.0 (from 55.1 Sep) — flat and well below 2024. Signals consumers still feel squeezed.
Institute for Social Research
+1
* Conference Board Consumer Confidence (Sep): 94.2 (1985=100), a 5-month low; “present situation” fell the most in a year. Next reading due late Oct.
The Conference Board
+1
* NY Fed Survey of Consumer Expectations (Sep): Inflation expectations rose to 3.4% (1-yr); 3.0% (3-yr); 3.0% (5-yr). That’s a nudge up at the short and long horizons.
Federal Reserve Bank of New York
+1
* Morning Consult daily/weekly sentiment: Real-time ICS shows soft, choppy confidence into mid-Oct (useful while official data are delayed).
Morning Consult Pro
+1
Cleveland Fed Inflation Nowcast: Daily model estimates for CPI/PCE (handy proxy until BLS resumes). Check their CPI/PCE nowcasts for late-Oct reads. (Sept numbers not in, but Apr - Aug shows steady increase in all four CPI metrics.)
Federal Reserve Bank of Cleveland
+1
* Small business lens (NFIB, Sep): Optimism slipped; more owners cite inflation and weak sales as top problems—often a leading signal for consumer conditions.
Investopedia
Takeaway: Sentiment is weak (UMich/Conference Board), inflation expectations ticked up (NY Fed), and high-frequency trackers (Morning Consult, Cleveland Fed nowcasts) suggest lingering price pressure even before the delayed CPI print lands.TRUMP WANTS TO BUY BEEF FROM ARGENTINA!
Nothing says America First like imported beef, right?
Trump told reporters on Air Force 1 yesterday that the United States could purchase Argentinian beef in an attempt to bring down the higher prices of US beef...
WHAT IN THE ACTUAL HELL
So 40 billion wasn't enough for Argentina? Now he wants the US to buy their beef?
Who wants beef grown in a foreign country, especially after mango Mussolini has gutted the food safety departments??? Recipe for disaster.
IF YOU'RE KEEPING TRACK...
We bailout Argentina for $40 billion
- They sell soybeans to China
- Our farmers get nothing & are going bankrupt because of his tariff policies...
Listen to this pompous ass... Wouldn't it be nice if he had that kind of concerns for Americans losing their health care.. THIS IS DISGUSTING
https://x.com/mmpadellan/status/1980250147389882465Here is the latest on the De Minimis inflation front. Now much change other then inflation keeps growing.
Here’s the weekly wrap for Sun Oct 27–Sat Nov 2, 2025 on the end of U.S. de minimis (in effect since Aug 29):
Oct 29 — CBP systems/filing: CBP issued a CSMS notice for an ACE certification maintenance window (Oct 29, 5–8 pm ET), signaling ongoing platform work as entries continue shifting off Section 321/Type 86.
GovDelivery
Oct 30 — ACE roadmap: CBP posted an updated ACE Development & Deployment Schedule (Oct edition), including importer-account and workflow enhancements relevant to brokers/importers handling low-value parcels as formal/informal entries.
Customs and Border Protection
Oct 31 — Inflation proxy (non-BLS): BEA’s Personal Income & Outlays (Sept) was slated for Oct 31, 8:30 am ET (includes PCE inflation). This is the cleanest read on consumer-price pressure since the Aug 29 policy change; the release is posted on BEA’s calendar and data pages.
Bureau of Economic Analysis
+1
This week — SCOTUS countdown: Multiple trackers flagged Supreme Court oral arguments on Nov 5 in the consolidated tariff/authority cases (which frame the legal backdrop for the administration’s trade moves). Previews posted 2–3 days ago.
SCOTUSblog
+1
Ongoing — Postal flows still depressed: The latest public UPU read (mid-Oct) remains that U.S.-bound international post is ~70% below normal, after the day-one –81% shock; resumptions are still patchy while operators adopt duty-collection tooling.
AP News
Context — Operations guidance: Reuters’ late-Oct recap still anchors the scale: since Aug 29, CBP processed ~24 million parcels that previously would have been duty-free, underscoring the volume now entering through standard entry channels.
Reuters
What changed vs. last week
Fresh system signals: New ACE maintenance and an updated deployment schedule landed this week; no new de-minimis-specific CSMS policy bulletin, but the tech cadence continues.
GovDelivery
+1
Data cadence: Unlike last week’s BLS CPI, this week’s BEA PCE (non-BLS) provides another inflation cut including goods categories affected by the de-minimis change.
Bureau of Economic Analysis
Legal clock: The Nov 5 Supreme Court arguments are now imminent; several outlets published previews this week.
SCOTUSblog
+1
Sources (5): CBP CSMS & ACE schedule; BEA release calendar/PCE page; Reuters (CBP 24 M parcels); AP/UPU postal status.
AP News
+5
GovDelivery
+5
Customs and Border Protection
+5A disturbing action.
ProPublica obtained records from the Department of Agriculture that detail the millions of pounds of food, down to the number of eggs, that never reached food banks because of the administration’s cuts.
The Trump administration abruptly cut $500 million in deliveries from a program that sends U.S.-produced meat, dairy, eggs and produce to food banks and other organizations across the country — about a quarter of the funding the program received in 2024. The items that were delivered through The Emergency Food Assistance Program were some of the healthiest, most expensive items that organizations distribute.
Why?
https://projects.propublica.org/trump-food-cuts/Is it because one or two Democrats might benefit. I hope he doesn't realize that his base is going to be hit hard and when they realize why, they may not be in his base anymore.
Here is a personal example of Trump's Tariff-caused inflation.
I periodically by Halva SuklaaLakuKuulat Salmiakki Liquorice 12 Packs of 140g. The last time I bought it the price was $36 and FREE shipping from Amazon. This time if I bought it (which I am not) it is $80 PLUS $30 shipping.
Also, since America doesn't produce this kind of salted chocolate balls, I won't be buying any replacement until Trump's tariffs are history. Since I am 78 now, I may be dead before that happens.
So, here is what Trump did to America.
1. Reduced Amazon's profit
2. Reduced taxes collected on that profit.
3. Eliminated the enjoyment I get from eating them.
4. On the bright side, those are a bunch of calories my wife and I won't be consuming.Trump is destroying the economy. Everything he is doing is increasing inflation. But at least he has a shiny new ballroom paid for by all the rich people he’s making richer with his kleptocracy.
Layoffs are rising to recession-like levels, new report says...
https://www.washingtonpost.com/business … ffs-trump/Just to drive the point home -
"Layoffs accelerated in October, pushing 2025 job cuts to levels typically seen in recessions, according to newly released data from Challenger, Gray & Christmas, a private firm that tracks workplace reductions.
U.S. employers have announced 1.1 million layoffs so far this year — the largest reading since the pandemic recession and on par with 2008 and 2009 job cuts during the Great Recession,"
I wonder how many of those are jobs MAUGA filled? I bet they are SOOOO happy they voted for the "enemy of the People" (Trump)Yep. He's brought back the pandemic economy without the pandemic!
We knew he would. He promised as much with his tariffs.
Another day.
Another lie.
Another community note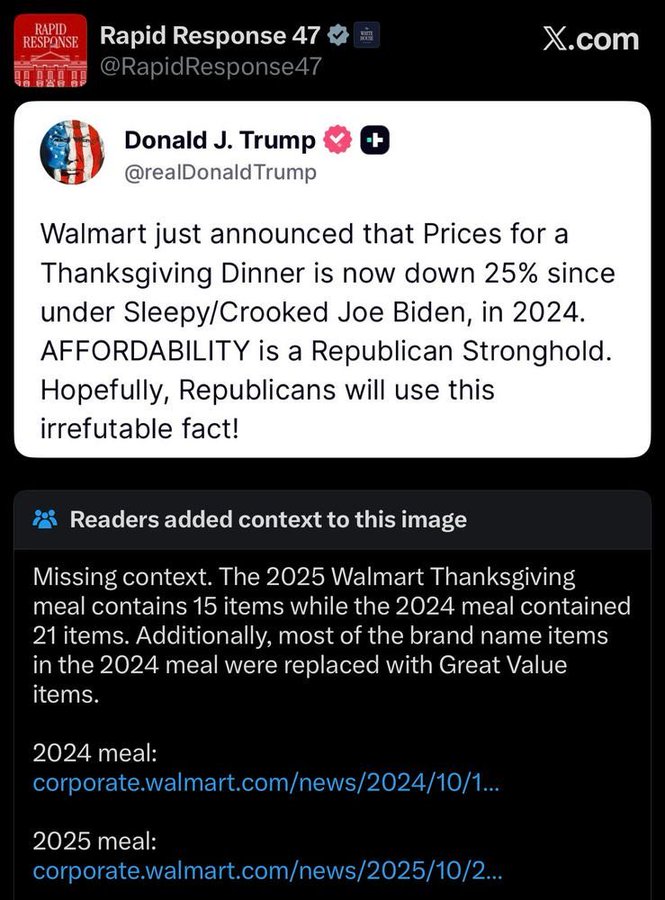
"Washington Post-ABC News-Ipsos poll conducted in early November 2025 shows that 70% of Americans have experienced rising grocery prices over the past year, with 60% attributing the increase to President Donald Trump. Bureau of Labor Statistics data confirms food-at-home prices rose 3.1% year-over-year through September 2025, linked to tariffs on imports and supply chain issues from deportations and outbreaks. Despite Trump's assertions of declining prices, economists connect these policies to higher costs for essentials like meats, eggs, and dairy,..."
You can't LIE about something people experience DAILY.... People who actually visit grocery stores know what's up... Folks who live in gilded palaces do not ..Given his mental illness and cognitive decline, Trump can AND DOES. When you ask neutral AI you get this answer.
Short version: Turkey is up; the whole meal is likely flat to slightly up—unless you chase promos, in which case it can be flat or even down.
Turkey costs: AFBF says wholesale turkey prices are up ~40% year over year due to disease and supply issues—so the bird itself will bite more of the budget. Retailers will still run aggressive holiday specials.
Farm Bureau
Everything else: “Food at home” inflation is running about +2.7% YoY into fall 2025, so sides and staples are only creeping up.
Empower
Promotions matter a lot this year: Big-box bundles (Walmart, Amazon, etc.) are pushing low headline prices for complete meals, which can offset the pricier turkey if you buy the basket.
People.com
Last year’s baseline: 2024’s classic AFBF basket for 10 people fell 5% to $58.08, still ~19% above pre-pandemic. 2025 hasn’t been published yet; expect something near flat-to-low-single-digit higher without promos.
Farm Bureau
+1
Bottom line: If you shop normally, plan on about the same or a little higher than 2024. If you lean into the holiday bundles/loss-leaders, you can likely match or beat last year’s cost despite the more expensive turkey.
Nobody has been crushed more from MAGA than blue collar workers.
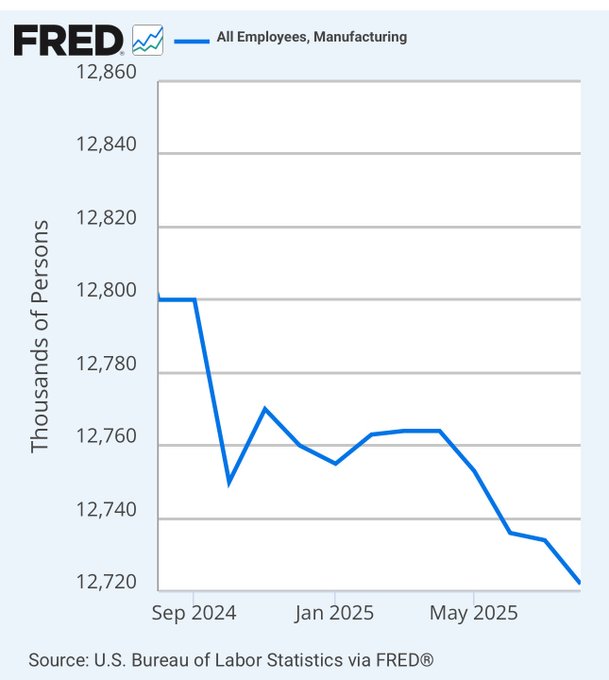
Clearly, mentally ill Trump is KILLING US MANUFACTURING.
There is always more to it than a chart, and a one-liner or a byline... There are roots...
I came across an article last week from Ford’s CEO, Jim Farley, and it really reinforced something I’ve been noticing for a while. Farley said Ford has around 5,000 open mechanic and skilled-trade positions, many paying well over $100,000, and they still can’t fill them. To me, that says a lot about what’s really happening in U.S. manufacturing. The media keeps bashing Trump by claiming “manufacturing jobs aren’t there,” but the real issue isn’t a lack of jobs. The jobs are there. The problem is that companies can’t find enough people with the training to take them.
When I look deeper, it’s clear this is a national workforce issue, not a manufacturing collapse. Reports show hundreds of thousands of manufacturing jobs remain open, and experts warn that millions more could go unfilled in the coming decade because of skill shortages, retirements, and the lack of younger workers entering the trades. Manufacturers themselves are saying that the shortage of skilled employees is holding them back from expanding, investing, and meeting demand.
So when I hear people say “manufacturing is failing,” I don’t buy it. What I see is a sector that’s hungry for workers, offering strong wages and opportunity,m but struggling to find people trained to do the work. That’s a workforce problem, not a sign that the industry is disappearing.
My sources
“Ford CEO says he has 5,000 open mechanic jobs with 6-figure salaries from the shortage of manually skilled workers: ‘We are in trouble in our country’” — Fortune. https://fortune.com/2025/11/12/ford-ceo … r-country/
Fortune
“US Manufacturing Boom: Where Are the Missing Workers?” — Manufacturing.net. https://www.manufacturing.net/labor/art … ng-workers
Manufacturing.net
“Study: Manufacturing in U.S. Could Need Up to 3.8 Million Workers” — The Manufacturing Institute / NAM News. https://nam.org/study-manufacturing-in- … ers-30626/
NAM
“The Manufacturing Skills Gap: What Is It?” — Manufacturing.net. https://www.manufacturing.net/labor/art … what-is-it
Manufacturing.net
NOW---[ let's turn to AI. I offered my research. Let's have a look at what our friend AI comes up with.
Great question. Blue-collar jobs today are generally doing pretty well, but it’s complicated — there are a lot of opportunities, but also real challenges. Here’s a breakdown of how things look, and where the risks are:
How Blue-Collar Jobs Are Doing Right Now
Strong Demand & Growth
There’s projected growth: about 1.7 million new blue-collar jobs are expected by 2032.
Forbes
Many of the fastest-growing roles are in trades like construction, manufacturing, renewable energy, and industrial maintenance.
Forbes
+1
Pay is increasingly competitive: some blue-collar jobs now offer six-figure salaries, especially for skilled roles.
Forbes
Labor Shortages Are a Big Issue
The construction industry is short hundreds of thousands of workers. One report estimates there are 439,000 additional workers needed just to meet 2025 demand.
RedHammer
In manufacturing, there are still hundreds of thousands of job openings — a lot of jobs are going unfilled.
Cargoson
A large portion of the blue-collar workforce is aging, which only deepens the gap as people retire.
Cargoson
Technology & AI Are Reshaping the Trades
While AI and automation get a lot of attention, many blue-collar roles are hard to fully automate. Physical work, on-site problem solving, and human judgment are still very much needed.
CNBC
+1
But trades are not untouched: new blue-collar roles increasingly require digital and technical skills — for example, people who can supervise robots or program machinery.
Forbes
Many blue-collar workers see AI as a complement, not a threat: it can boost productivity and raise the quality of jobs.
Forbes
Shifting Workforce Trends
Younger workers (Gen Z) are actually moving toward blue-collar jobs more than before, partly because they see them as more stable and less risk of being replaced by AI.
CNBC
But satisfaction is mixed: a Newsweek survey found that 65% of blue-collar workers aged 18–29 view their job as just a way to “get by”, not a long-term career.
Newsweek
Upskilling is becoming more important: employers are investing more in training for tradespeople because they need people who can work with modern tools, not just do manual labor.
AInvest
+1
Wages & Costs
Turnover is expensive: replacing a skilled blue-collar worker can cost employers $10,000–$40,000, so many companies are raising wages and improving training.
AInvest
Some of the highest-paying blue-collar roles are extremely competitive: for instance, elevator/escalator technicians, line installers, and wind turbine techs are among the top-paying ones.
Forbes
Risks & Headwinds
Immigration enforcement is creating pressure: in some regions, construction companies are struggling because of limited labor from immigrant workers.
Houston Chronicle
The “skills pipeline” is still a long-term problem: there’s not enough investment in vocational training or apprenticeships to fill future demand, especially as older workers retire.
RedHammer
+1
Some blue-collar sectors are declining in workforce share (even if not in absolute numbers), which could make certain geographic areas or industries more vulnerable.
AInvest
Bottom Line
Blue-collar jobs are not failing — in fact, many are thriving. There is strong demand for skilled trade workers.
The bigger issue is finding and training enough qualified people — not a lack of blue-collar opportunities.
For people willing to learn a trade, there’s real potential for high pay and job security. But to fully realize that, both government and industry need to keep investing in vocational education and apprenticeships.
If you like, I can pull up 2025-specific government data (BLS, Department of Labor) to show exactly how blue-collar jobs are trending this year. Do you want me to do that?
I said No to the AI offerFrom one of the posted sources
"The U.S. had more than 415,000 open manufacturing jobs in June 2025. Projections show that by 2033 the industry could need 3.8 million new workers and that almost half of those jobs could go unfilled.
Immigrants make up about 20% of the manufacturing workforce. Their position has become less certain as immigration flows have slowed. If that supply tightens, the gap will only get bigger."
As the population decreases in this country and the native-born track toward college degrees, overly restrictive immigration policy certainly will not aid in filling these gaps.
An additional barrier cited by the other source: "more people flock to white-collar jobs for more job stability, upward career mobility, and higher wages. ". Manufacturing probably needs to do a better marketing job to potentially draw in some of the crowd that may be open to the idea of the trade school path rather than college.I agree that the U.S. faces a manufacturing labor shortage, with 415,000 open jobs in June 2025, and projections of nearly 3.8 million new workers by 2033 are significant. Immigrants do make up about 20% of the workforce, but it’s important to note that many of these roles are already being filled legally through work visa programs.
Companies can hire foreign workers for positions they cannot fill domestically, which is exactly what the system is designed for. From that perspective, immigration policy isn’t inherently a barrier; the visa program is a tool to legally address the labor gap.
At the same time, in my view, relying solely on immigration or visas isn’t a complete solution. Many of these manufacturing roles require specific technical skills and training. U.S. students are increasingly pursuing college degrees, and fewer are entering trade schools.
Manufacturing needs to make careers more attractive, through competitive pay, benefits, and clear advancement pathways, to draw domestic talent into skilled technical roles. For instance, Ford’s initiative to offer six-figure salaries to technicians is a step in the right direction. Ford's benefits are wonderful, and this alone should be an incentive to become a skilled tradesman.
Marketing manufacturing as a high-tech, well-paid career path is critical. Combining domestic workforce development with legal, targeted use of work visas can realistically help close the labor gap. There’s no reason why immigration restrictions should hinder this; when properly implemented, the visa system complements U.S. workers rather than replaces them. This is how it has worked for decades.Yes, I know you were and I replied to your reply.
Question - who is relying solely on immigration?
I was about to agree with you on the college quip but decided to check - I learned something that is very disappointing.
. College isn’t “increasingly” being chosen – it’s been shrinking
Undergraduate college enrollment fell from 18.2 million in 2010 to 15.9 million in 2023.
Several analyses describe this as roughly a 15–20% drop in undergrad since 2010, depending on the exact years you pick.
The college enrollment rate for 18–24-year-olds went from 41% in 2012 to 39% in 2022.
The share of recent HS grads going straight to college is also down (e.g., 62.8% in 2024 vs 66.8% in 2019).
There has been a small rebound post-COVID (NSC shows undergrad enrollment up ~3–3.5% from 2024 to 2025), but it’s still below pre-pandemic and well below 2010.
So: fewer young people are choosing college than a decade ago, not more.
2. Trade / vocational programs are growing, not shrinking
Multiple sources point in the same direction:
One industry report: trade-school enrollment grew 4.9% from 2020–2023 while university enrollment declined.
Validated Insights: trade-school enrollment is projected to grow 6.6% per year through 2030, vs 0.8% per year for higher ed overall.
NSC data: enrollment at public two-year schools with a “high vocational focus” grew 13.6% in Fall 2024, the second year of double-digit growth.
Another snapshot: trade-school enrollment up 16% from 2022 to 2023, with over a million students in vocational programs.
Plus, high-school CTE participation is widespread (about 85% of 2019 HS grads took at least one CTE course).
So the pipeline into the trades is not collapsing; if anything, it’s in a mini-boom relative to traditional bachelor’s pathways.
But back to the basics, if we keep reducing immigration as Trump wants to do, our economy WILL stall out someday.
Why you ask? Because there aren't enough native born Americans to sustain growth - it is a fact that without immigration, our population will shrink. Surprisingly, there are some in these forums who think that is a good thing. But, logically and mathematically it is not.
Here is what ChatGPT reports on changes in demographics under some alternative immigration scenarios. Check the bolded one.
Short version: with immigration, the U.S. stays ~370M+, slowly aging but still growing and relatively diverse; without immigration, the population shrinks by roughly a third, gets much older, and becomes less diverse.
Here’s what that looks like using the Census Bureau’s 2023 projections and related work:
1. Total population size
By 2100 (Census 2023 projections):
Census.gov
* With “middle” immigration (roughly current trends):
366 million people (up modestly from 2022).
* High immigration scenario:
435 million (much larger and still growing).
* Low immigration scenario:
319 million (peaks mid-century, then declines).
* Zero-immigration scenario (no new foreign-born at all):
226 million people – about 107 million fewer than today’s population estimate, and about 140 million fewer than under the main (current-immigration) scenario. That is where the nativists want to take us
Census notes that without immigration, population declines start almost immediately (around 2024), while with immigration, growth continues—though slowly—through most of the century.
Census.gov
+1
2. Age structure – how old the country looks
Age 65+ and median age in 2100:
Census.gov
+1
With current-trend immigration (middle scenario):
Share 65+: ~29% of the population
Median age: 47.9
With zero immigration:
Share 65+: about 35.6% (more than one in three people)
Median age: 53.6
So zero immigration doesn’t just reduce headcount; it gives you a much older society.
A National Academy of Sciences analysis did a similar comparison for 2065: with projected immigration, you get 47.5 seniors per 100 working-age adults; without immigration after 2015, that jumps to 55.9 seniors per 100 workers—a significantly heavier old-age burden on each worker.
National Academies Press
3. Racial & ethnic composition
Census gives race/ethnicity projections out to 2060 under different immigration assumptions:
Census.gov
+1
By 2060:
Non-Hispanic White share
Middle (current) immigration: 44.9%
High immigration: 42.7%
Low immigration: 46.6%
Zero immigration: 50.7%
Hispanic share
Middle: 26.9%
High immigration: 27.8%
Low immigration: 26.2%
Zero immigration: 24.6%
Non-Hispanic Black share: stays around 13% in all scenarios.
The key point: even with zero immigration, the U.S. still becomes more diverse than today, but immigration makes it more diverse, faster (more Hispanic and Asian growth, smaller non-Hispanic white share).
Census.gov
+1
4. Nativity (foreign-born vs native-born)
By 2100:
Census.gov
With current-trend immigration:
Foreign-born share: rises from 13.9% (2022) to 19.5%.
High immigration:
Foreign-born share: about 24.4%.
Low immigration:
Foreign-born share: 14.9%.
Zero immigration:
Foreign-born share: collapses to just 0.3% (only those already here and surviving).
5. Growth drivers: births, deaths, and immigration
Fertility is projected to stay well below replacement (~1.6–1.7 children per woman).
That means natural increase (births minus deaths) eventually turns negative in every scenario—even the high-immigration one.
Penn Wharton Budget Model
The Census Bureau and other analysts are very explicit: outside the zero-immigration scenario, immigration becomes the main driver of any remaining population growth.
Census.gov
Without immigration, you get:
A shrinking population
A sharper rise in the old-age share
A much higher worker-to-retiree burden
Still increasing diversity, but less than under current immigration levels
With immigration (even at today’s levels), you get:
Modest continued growth instead of decline
A less extreme aging profile
A larger workforce and tax base to support retirees
A more racially and ethnically diverse population
In terms of GDP, it looks something like this. Currently, our GDP is $24.3 T (2018$)
* By 2050, with no immigration, it would be a paltry $29 T (2018$)
* By 2050, with normal growth, it would be $37T (2018$)
* By 2050, with high immigration growth, it is estimated to be $47 T (2018$)
Which scenario do you want?
Trump is attempting to drive us to the low or no immigration scenario (save for those he wants to hire for his properties)
The chart was showing what is happening now, not in the future. And while what you and AI say might end up being true years from now, it isn't what is happening now.
It’s true there are still hundreds of thousands of openings in manufacturing and that employers, especially in the auto sector, complain about a shortage of skilled workers. But national data also show manufacturing employment down over the last year and basically flat at pre-COVID levels, not booming. Jim Farley is mostly talking about auto mechanics and techs, not the whole manufacturing base, and industry projections about ‘millions of unfilled jobs’ are about future skill pipelines, not current job growth. So yes, there’s a workforce and training problem in some niches—but that doesn’t erase the fact that overall manufacturing jobs have been declining, which is what the FRED charts are actually showing.
And if Trump keeps up his tariff war for another three years, then neither your, not AI's rosy picture of future job growth will turn into reality.I was replying to your comment where you expressed this ---
"My Esoteric wrote:
Clearly, mentally ill Trump is KILLING US MANUFACTURING.
I shared the information I uncovered through my own research and provided the sources I used. I also included a fair, non-biased AI perspective that aligns with my own thoughts on your view. I simply don’t feel that Trump is “killing” U.S. manufacturing. In my opinion, he has the potential to bring some of it back.
There’s no argument that manufacturing has been declining for decades, and for a variety of reasons that at this point are water under the bridge. What matters to me is that we finally have a president who is at least willing to try to rejuvenate the sector and restore it in ways we haven’t seen in years. It’s a deeply complicated issue, and I’m not going to pretend I can unpack all of it in a chat.
Regarding the tariff war, and what will shake out is way above my head. I have done a lot of research over the last many months, and I can see it is not for the layman to discuss. Too many variables, too many sideline economists.
Prices aren't coming down. Trump lied. They started going up as soon as he took the wheel.That is graphic enough for me, Joel, thanks for bring this to our attention.
You notice the silence from the right? That is because you can't hear their voices with all that sand in the way.
TACO Trump just reversed some of his tariffs, maybe because of the message voters sent him a little while ago.
"Trump’s latest tariff TACO probably won’t make your life more affordable"
https://www.cnn.com/2025/11/15/business … ordability
https://www.cnn.com/2025/11/14/economy/ … as-produce
At the bottom of the first link is a nifty little gadget that lets you check out how prices have changed from the last month and a rolling 12-month average by commodity. Which it had a static 12-month look as well.There is an affordability crisis in America.
To live comfortably as single adult using 50/30/20 rule: one would need to make $46.40/hr or $96.5K/year.
The top 18% of Americans earned over $100,000 in 2024, meaning that the remaining 82% earn less than that amount."Home Depot’s business is stuck. That’s a bad sign for the economy"
We are not out of the "woods" yet. We have little October data to help gauge things, so metrics like this help.
"The housing market is frozen, and consumers are nervous about the economy. That’s a bad recipe for Home Depot.
The bellwether for US consumers and the housing market said Tuesday that its sales at US stores open for at least one year rose only 0.2% last quarter. It also cut its profit forecast for the year.
Home Depot attributed the slowdown to consumers cutting back on remodeling projects and big home upgrades. Mortgage rates have been stuck between 6% and 7% in recent years, leading fewer people to buy and sell their homes.
“We believe that consumer uncertainty and continued pressure in housing are disproportionately impacting home improvement demand,” Home Depot CEO Ted Decker said in a statement.
The company also said that fewer major storms and extreme weather events last quarter led to weaker customer demand for roofing materials, backup power generators and plywood.'
https://www.cnn.com/2025/11/18/business … ot-economyAnother sign -
"‘Everyone is hunkering down.’ The affordability crisis is rattling mom-and-pop shops"
"
Surging import costs. Mounting payroll and healthcare expenses. A shortage of affordable loans. And a stressed-out workforce. Small businesses are facing mounting pressure from America’s affordability crisis.
Doug Scheffel, owner of a family-run ETM Manufacturing in Massachusetts, laid off about a quarter of his employees in April as the Trump administration’s haphazard tariff rollout dented demand for the machine parts and sheet metal his company sells.
“Everyone is hunkering down and building up cash. It’s never been this bad,” Scheffel told CNN in a phone interview. “It’s very uncertain and impossible to plan in this environment.”
Small businesses are the backbone of the US economy, accounting for the vast majority of total businesses in the nation, nearly half of all employees and the bulk of the job growth."
https://www.cnn.com/2025/11/18/business … l-businessThe Sept jobs report is out and it is a mixed bag.
* 119,000 jobs were created for Sept, well above the 50,000 that was projected
* Unemployment skyrocketed* from 4.3% to 4.4%. (* I use that term tongue-in-cheek because it was used frequently by others here to describe falling inflation)
* August lost 4,000 jobs and July was reduced.
* The improving sectors were health care and social assistance. I guess that was it.
* The participation rate increased slightly from 62.2% to 62.3%
Also in the news - great news for the Democrats
"The latest Fox News* poll paints a picture of a nation deeply frustrated by the economic policies of the man hired to fix the economy.
A staggering 76% view the economy negatively (up from 67% in July). Clear majorities say costs have increased for utilities (78%), health care (67%) and housing (66%).
Just 15% say President Donald Trump’s policies have helped matters, compared with 46% who say they have hurt conditions. Tellingly, that -31 point reading is comparable to the -30 reading at the end of former President Joe Biden’s term." - * The Fox News Poll is the one honest part of an otherwise dishonest and untrustworthy Fox News service.
On Retail
"While results have varied significantly across companies, it’s clear consumers are becoming more price sensitive, and in some cases, cutting back spending.
For instance, Target reported the average transaction was down 0.5% last quarter compared to a year prior.
Meanwhile, TJ Maxx said on their earnings call earlier this week that the company’s success last quarter is owed in part to consumers across income levels looking for better prices on goods.
And Walmart’s earnings report showed that more higher-income Americans are turning to the store to seek relief from stubborn inflation.
Overall, the week’s earnings paint a picture of a cautious consumer intent on seeking out deals."
https://www.cnn.com/business/live-news/ … 3648502272Layoffs are a-coming!!
"Corporate America is increasingly reckoning with economic headwinds and, as a result, there’s been a surge in layoff announcements.
Last month alone, Challenger, Gray & Christmas, a staffing agency that tracks employment trends, reported that companies announced 153,000 cuts, a 175% increase from October 2024.
Advancements in AI as well as higher costs stemming from tariffs are behind many of the cuts.
Here are some of the largest recent corporate cuts:
UPS: Disclosed in recent earnings report 48,000 workers were laid off this year
Verizon: Announced Thursday that it was laying off around 13,000 employees
Amazon: 14,000 workers laid off
Target: 1,000 employees laid off and 800 open roles eliminated
Paramount: 10% of workforce cut.
17 min ago
Verizon is laying off 13,000 employees"
https://www.cnn.com/business/live-news/ … 3648502272Good thing we're opening up tens of thousands of new jobs that used to be filled by illegal aliens, isn't it?
WOW! Guess we did not need the millions of illegal migrants Biden let flow in, and the liberals have been shouting that we need them to fill all the many jobs that will go unfilled if Trump deports them. It would seem to me that it must be hard for any liberal to keep their narratives even a bit straight. LOL
In the coming year, we will see so many jobs that we will actually need to continue to import Visa workers.First, It is misinformation to say " illegal migrants Biden let flow in"
Second, Biden wasn't into terrorizing Americans and immigrants like Trump is.
Third, 1. You’re taking one scary headline and ignoring the rest of the labor market
Yes, Challenger says 153,074 announced job cuts in October, up 175% from a year earlier, and just over 1.09 million cuts year-to-date.
But put that in context:
The U.S. has about 159.6 million nonfarm payroll jobs as of September.
Those 1.09 million cuts YTD are well under 1% of total jobs.
At the same time, we still have about 7.2 million job openings (JOLTS, August).
So we’re looking at:
~1.1M announced cuts vs ~7.2M open jobs in a 160M-job economy.
That’s a cooling labor market, not “we don’t need workers anymore.”
And Challenger’s own breakdown shows warehouse and tech leading October cuts, with cost-cutting and AI as top reasons.
That’s not the same labor pool as the folks picking vegetables, doing elder care, or cleaning hotel rooms.
2. Layoffs ≠ “we don’t need migrants”
Layoffs are reallocation, not a simple “jobs vanish” story:
People laid off from UPS, Verizon, Amazon, etc. don’t just sit on a shelf; many are re-employed in other sectors.
Meanwhile, we still have millions of unfilled jobs, especially in:
health care and elder care
hospitality
agriculture and food processing
Those are precisely the sectors where immigrants (authorized and unauthorized) are heavily represented.
So using a wave of announced white- and blue-collar layoffs to claim “we didn’t need millions of migrants” is like saying:
“Target closed some stores, therefore no one needs nurses or farmworkers anymore.”
Different sectors, different skills, different locations.
3. What the data actually say about immigration and jobs
Recent mainstream research is pretty clear:
Immigration has accounted for almost half of U.S. labor-force growth since 1995.
Without immigration, the working-age population would already be shrinking, which is terrible for long-run growth.
Immigrants are now about 19% of the labor force.
On the “do they steal jobs” question:
A St. Louis Fed analysis of the recent surge in immigration through 2024 finds no meaningful effect on native unemployment; the uptick in unemployment is explained by other things, not immigrants “taking all the jobs.”
A meta-analysis covering 88 studies over decades finds immigration has small to near-zero effects on natives’ wages, and sometimes positive in the long run.
So the actual empirical record doesn’t back the “we didn’t need them” narrative. It backs:
“We have an aging native workforce, and immigration prevents the labor force from shrinking and the economy from stalling.”
4. Your own last sentence undermines your point
You wrote:
“In the coming year, we will see so many jobs that we will actually need to continue to import Visa workers.”
That is the argument you say “liberals” are wrong about:
If layoffs now mean we didn’t need migrants,
Why do you expect “so many jobs” that we’ll need to import visa workers next year?
You can’t have it both ways:
Either there’s persistent labor demand that we’ll struggle to meet without foreign workers,
Or the October layoff headlines prove the market is permanently glutted and we don’t need them.
The actual data line up with your last sentence and not your “gotcha”:
We’re in a slowing but still tight labor market (4.3–4.4% unemployment, millions of openings).
We’ve got a big demographic problem without immigration.
So if you want to argue about how many immigrants and in what status, fine. But “a month of ugly layoff headlines proves we never needed them at all” just doesn’t survive even basic arithmetic, much less the actual research.
Getting back to jobs---- How about the great jobs report today! Yes — that’s correct. The Bureau of Labor Statistics reported a gain of 119,000 jobs in September was more than double what economists had been expecting (roughly 50,000.
While Trump's terrible economy is very bad for Americans, the silver lining is Democrats can start trying to repair it come Jan 2027.
Republican reelection chances keep dropping by the day because of Trump. For example, this quote from a credit repair lady in bellwether state PA.
"“Everything is going up except the wages here. This is the Lehigh Valley, or the hub between Philadelphia and New York, and they are raising prices and the locals really can’t afford to keep up.”
Bethlehem is synonymous with blue-collar America, and because of the area’s voting history it is a laboratory for testing the national mood. Right now, plenty of people are living paycheck to paycheck; more and more are asking to meet with Jones because of an affordability crisis.
They tell her a range of stories. “My husband lost all of his overtime,” is one Jones often hears. Or also: “My kids’ daycare went up. Can’t afford the cost of food. Using credit cards for everyday expenses. No money left after the bills are paid.”
“Pretty much just a whole bunch of financial mess,” she says."
This is how SO MANY MAUGA feel today:
"Jones is a three-time Trump voter. She still believes he is more qualified than Kamala Harris, his Democratic opponent in the last election.
But now, she is blunt in saying he has simply failed to keep his 2024 campaign pledge to make life more affordable.
“I’m very let down by that. Very, very let down because it’s — I feel like it’s only gotten worse,” she said."
Healthcare is also killing the Republicans. Democrats gave them a chance to fix it but Republicans said NO, let the premiums triple.
"John and Lisa Ronca own the shop, and have a teenage daughter who rides competitively. They get their health insurance through the Affordable Care Act exchange, and their renewal letter just came.
“It’s tripling,” Lisa Ronca said, repeating herself as if in disbelief. “It’s going to be triple, triple, triple this year, which equates to double the cost we pay for our mortgage, for our house. So we can’t keep that plan, to say the least.”"
To the degree they don't feel the same is an indication of 1) how well off they are or 2) how deep they are into the Trump cult.
https://www.cnn.com/2025/11/22/politics … vania-aotmIn addition to the mixed jobs report last week, a little more economic data was revealed today:
* The Wholesale inflation index Rose .3% for September. But, because August was revised Downward a tiny bit, annually it remained at 2.7%
* September sales (seasonally adjusted) rose 0.2%, down from an expected 0.3%.In addition, Consumer Confidence FELL to its lowest level since April 2025.
Potential bad news for the upcoming BLS jobs report. ADP says 32,000 jobs were LOST in November.
"Small businesses are “starting to crack” amid a weakening economy, rising costs and fickle consumers; and they drove job losses in the US private sector in November, new data showed Wednesday.
Payroll giant ADP estimated that 32,000 jobs were lost in the private sector last month, a large drop-off from the upwardly revised 47,000 jobs gained in October.
The job losses were overwhelmingly at small establishments (classified as having between one and 49 employees), which shed an estimated 120,000 jobs last month. Medium and large businesses added 51,000 jobs and 39,000 jobs, respectively.
By industry, the losses were more broad based, with some of the deeper drops in industries such as professional and business services, information and manufacturing."
For those that are curious, ADP and BLS have a .98 (very high) correlation over time. But in 2025, monthly divergence is not unknown.
Also, recent retail purchase analysis shows a 4% growth in brick-and-mortar stores (1% after inflation). But, that growth is only from the wealthy. Normal folk are cutting back purchases.
https://www.cnn.com/2025/12/03/economy/ … t-novemberI am counting on people having buyers remorse. I knew people who voted for Trump not over any cultural or ideological nonsense but as the better choice for fixing an economy that really was already going in the right direction with Joe Biden.
When independents and non-MAGA realize that Trump sold them a bill of goods regarding the economy, the only fools left will be the hardcore MAGA class and yet their numbers by themselves wont be enough to save them from the onslaught waiting next November.
Trump had better get the economics right, or he is through. When Democrats take control his agenda he will simply cease to exist.Do you think enough Senate Republicans will cross the aisle to convict Trump for War Crimes?
Are you kidding, as far as I know the Republicans may well be just stirring up dust with their inquiries for public consumption.
They have allowed Trump to usurp their responsibilities as defined in the Constitution, which is totally unprecedented.
They have allowed Trump to violate law and precedence with impunity and lack of oversight for forever and a day, why would I even imagine that they would grow the necessary backbone and spine overnight?
While they may be a few that cross, I doubt that it will be enough…..


Related Discussions
- 43

Is Trump's Tariffs Going to Cause Inflation and Recessions.
by Scott Belford 3 months ago
This topic deserves its own space.Most economists think Trump's chaotic. seat-of-the-pants Tariff War against the world WILL cause significant inflation and possibly a Major Recession. I'll start with this analysis that I posted elsewhere.Let's review the latest on inflation and it is not good news...
- 102

Tarriffs:Trump, a father of a new Golden Age or is it a Golden Shower?
by Credence2 8 months ago
Once again, the great stone head is now calling himself a scholar of economics. He tells us now that the economic turnaround would now "take time", while on the campaign trail he was telling us that it would occur overnight. On March 13th, there will be an assessment of the inflation...
- 42

Trump’s Insane Tariff War Is Killing Consumer Loved Dollar Tree Stores
by JAKE Earthshine 6 years ago
And just about everything else: His crazy reckless ineptitude is causing massive gas and product tax hikes which is passed on to all Americans: While retarded, dangerously unhinged ‘Donald the Bozo CLOWN’ falls perversely in love with an evil N Korean dictator named Kim Jung Un like the natural...
- 15

President Donald Trump's Tariffs are working
by Readmikenow 3 months ago
From the left-leaning Fortune Magazine."Trump is bringing in enough revenue from tariffs to cut deficits by $4 trillion over the next decade, CBO saysPresident Donald Trump’s hike in tariffs is projected to generate enough revenue to cut federal deficits by $4 trillion over the next decade,...
- 16

Was FEMA's Response to the 2025 Central Texas Flood Reasonable?
by Scott Belford 4 months ago
It took FEMA, under Trump, three to four days to respond to the flood. In the past, they started responding in 12 hours. What went wrong?
- 8

Trump's Tariffs are a Regressive Tax that affects his base.
by Mike Russo 6 years ago
1. Tariffs are paid by the importer.2. Tariffs disrupt supply chains.3. Tariffs cause the cost of goods to increase and that increase is passed on to the consumer, therefore raising prices.4. Rich people can afford that increase in price, poor...